吴恩达2022新版机器学习课后题-多变量回归预测房价

个人笔记,还有很多不懂的地方,如有错误欢迎指出

问题描述

多变量回归预测房价 训练样本在house.txt中,包含特征:size(sqrt)’,‘bedrooms’,‘floors’,‘age’和’price’

使用传统方法实验

多变量回归模型: 20220711094938

 1
 2
 3
 4
 5
 6
 7
 8
 9
10
11
12
13
14
15
16
17
18
19
20
def predict(x, w, b): 
    """
    single predict using linear regression
    Args:
      x (ndarray): Shape (n,) example with multiple features
      w (ndarray): Shape (n,) model parameters   
      b (scalar):             model parameter 
      
    Returns:
      p (scalar):  prediction
    """
    p = np.dot(x, w) + b     
    return p 
# get a row from our training data
x_vec = X_train[0,:]
print(f"x_vec shape {x_vec.shape}, x_vec value: {x_vec}")

# make a prediction
f_wb = predict(x_vec,w_init, b_init)
print(f"f_wb shape {f_wb.shape}, prediction: {f_wb}")

计算多变量的代价: 20220711095402

 1
 2
 3
 4
 5
 6
 7
 8
 9
10
11
12
13
14
15
16
17
18
19
20
21
22
23
24


def compute_cost(X, y, w, b):
    """
    compute cost
    Args:
      X (ndarray (m,n)): Data, m examples with n features
      y (ndarray (m,)) : target values
      w (ndarray (n,)) : model parameters
      b (scalar)       : model parameter

    Returns:
      cost (scalar): cost
    """
    m = X.shape[0]
    cost = 0.0
    for i in range(m):
        f_wb_i = np.dot(X[i], w) + b  # (n,)(n,) = scalar (see np.dot)
        cost = cost + (f_wb_i - y[i]) ** 2  # scalar
    cost = cost / (2 * m)  # scalar
    return cost

cost = compute_cost(X_train, y_train, w_init, b_init)
print(f'Cost at optimal w : {cost}')

计算梯度: 20220711095748 20220711095821

 1
 2
 3
 4
 5
 6
 7
 8
 9
10
11
12
13
14
15
16
17
18
19
20
21
22
23
24
25
26
def compute_gradient(X, y, w, b): 
    """
    Computes the gradient for linear regression 
    Args:
      X (ndarray (m,n)): Data, m examples with n features
      y (ndarray (m,)) : target values
      w (ndarray (n,)) : model parameters  
      b (scalar)       : model parameter
      
    Returns:
      dj_dw (ndarray (n,)): The gradient of the cost w.r.t. the parameters w. 
      dj_db (scalar):       The gradient of the cost w.r.t. the parameter b. 
    """
    m,n = X.shape           #(number of examples, number of features)
    dj_dw = np.zeros((n,))
    dj_db = 0.

    for i in range(m):                             
        err = (np.dot(X[i], w) + b) - y[i]   
        for j in range(n):                         
            dj_dw[j] = dj_dw[j] + err * X[i, j]    
        dj_db = dj_db + err                        
    dj_dw = dj_dw / m                                
    dj_db = dj_db / m                                
        
    return dj_db, dj_dw

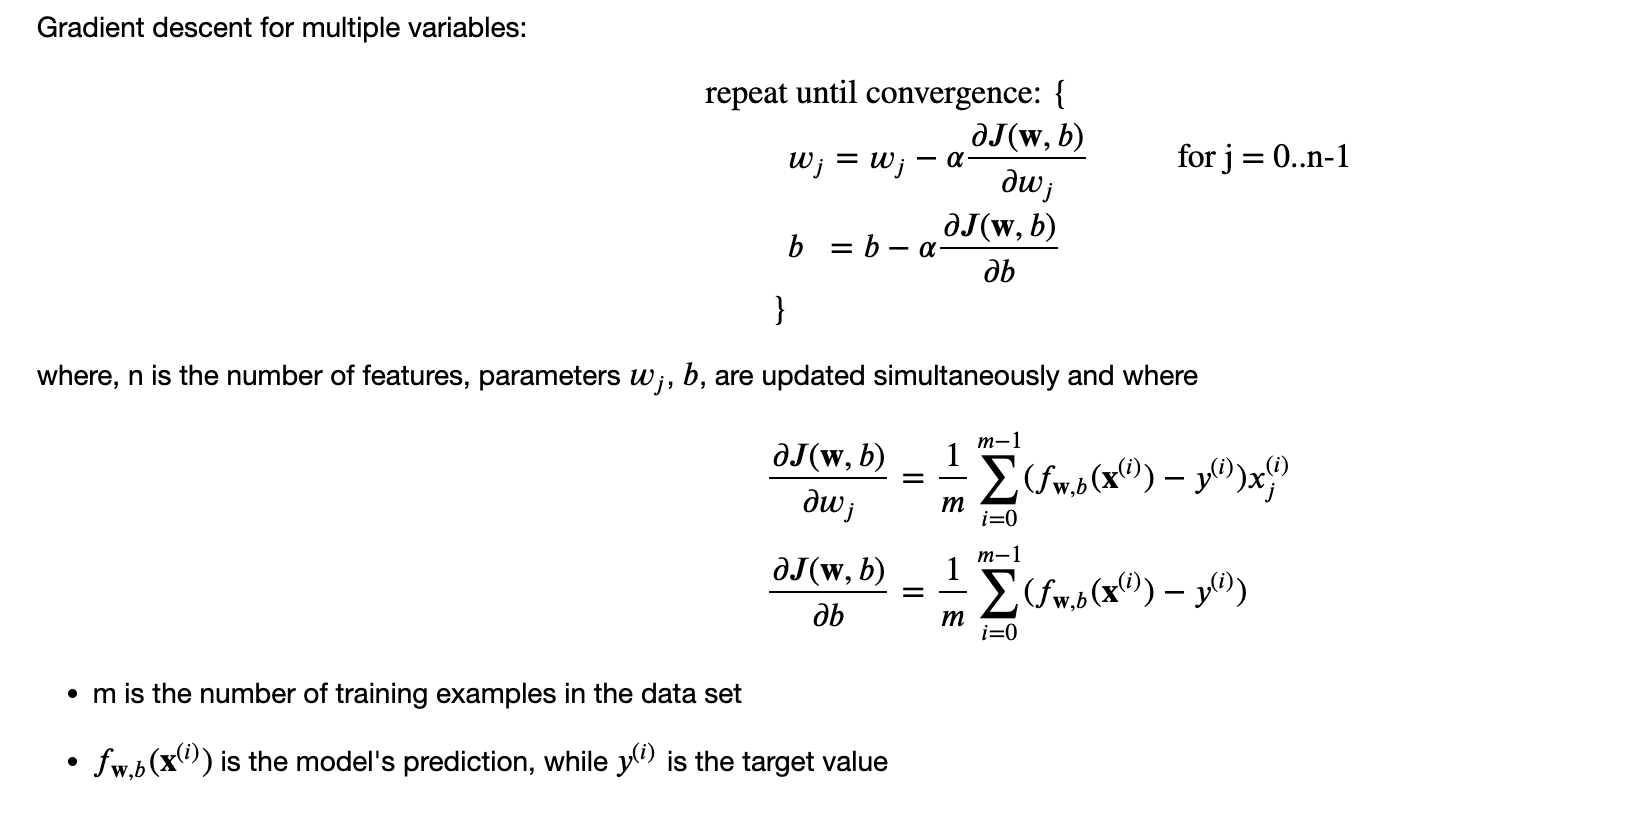
进行梯度下降:

 1
 2
 3
 4
 5
 6
 7
 8
 9
10
11
12
13
14
15
16
17
18
19
20
21
22
23
24
25
26
27
28
29
30
31
32
33
34
35
36
37
38
39
40
41
42
43
44
45
46
47
48
49
50
51
52
53
54
55
56
57
58
59
60
61
62
63
64
65
66
67
68
69
70
71
72
73
74
75
76

def gradient_descent(X, y, w_in, b_in, cost_function, gradient_function, alpha, num_iters): 
    """
    Performs batch gradient descent to learn theta. Updates theta by taking 
    num_iters gradient steps with learning rate alpha
    
    Args:
      X (ndarray (m,n))   : Data, m examples with n features
      y (ndarray (m,))    : target values
      w_in (ndarray (n,)) : initial model parameters  
      b_in (scalar)       : initial model parameter
      cost_function       : function to compute cost
      gradient_function   : function to compute the gradient
      alpha (float)       : Learning rate
      num_iters (int)     : number of iterations to run gradient descent
      
    Returns:
      w (ndarray (n,)) : Updated values of parameters 
      b (scalar)       : Updated value of parameter 
      """
    
    # An array to store cost J and w's at each iteration primarily for graphing later
    J_history = []
    w = copy.deepcopy(w_in)  #avoid modifying global w within function
    b = b_in
    
    for i in range(num_iters):

        # Calculate the gradient and update the parameters
        dj_db,dj_dw = gradient_function(X, y, w, b)   ##None

        # Update Parameters using w, b, alpha and gradient
        w = w - alpha * dj_dw               ##None
        b = b - alpha * dj_db               ##None
      
        # Save cost J at each iteration
        if i<100000:      # prevent resource exhaustion 
            J_history.append( cost_function(X, y, w, b))

        # Print cost every at intervals 10 times or as many iterations if < 10
        if i% math.ceil(num_iters / 10) == 0:
            print(f"Iteration {i:4d}: Cost {J_history[-1]:8.2f}   ")
        
    return w, b, J_history #return final w,b and J history for graphing

# initialize parameters
initial_w = np.zeros_like(w_init)
initial_b = 0.
# some gradient descent settings
iterations = 1000
alpha = 5.0e-7
# run gradient descent 
w_final, b_final, J_hist = gradient_descent(X_train, y_train, initial_w, initial_b,
                                                    compute_cost, compute_gradient, 
                                                    alpha, iterations)
print(f"b,w found by gradient descent: {b_final:0.2f},{w_final} ")
m,_ = X_train.shape
for i in range(m):
    print(f"prediction: {np.dot(X_train[i], w_final) + b_final:0.2f}, target value: {y_train[i]}")

m = X_train.shape[0]
yp = np.zeros(m)
for i in range(m):
#     print(f"prediction: {np.dot(X_train[i], w_final) + b_final:0.2f}, target value: {y_train[i]}")
    yp[i] = np.dot(X_train[i], w_final) + b_final

# # plot predictions and targets versus original features
fig, ax = plt.subplots(1, 4, figsize=(12, 3), sharey=True)
for i in range(len(ax)):
    ax[i].scatter(X_train[:, i], y_train, label='target')
    ax[i].set_xlabel(x_features[i])
    ax[i].scatter(X_train[:, i], yp, color="#FF9300", label='predict')
ax[0].set_ylabel("Price")
ax[0].legend()
fig.suptitle("target versus prediction using z-score normalized model")
plt.show()

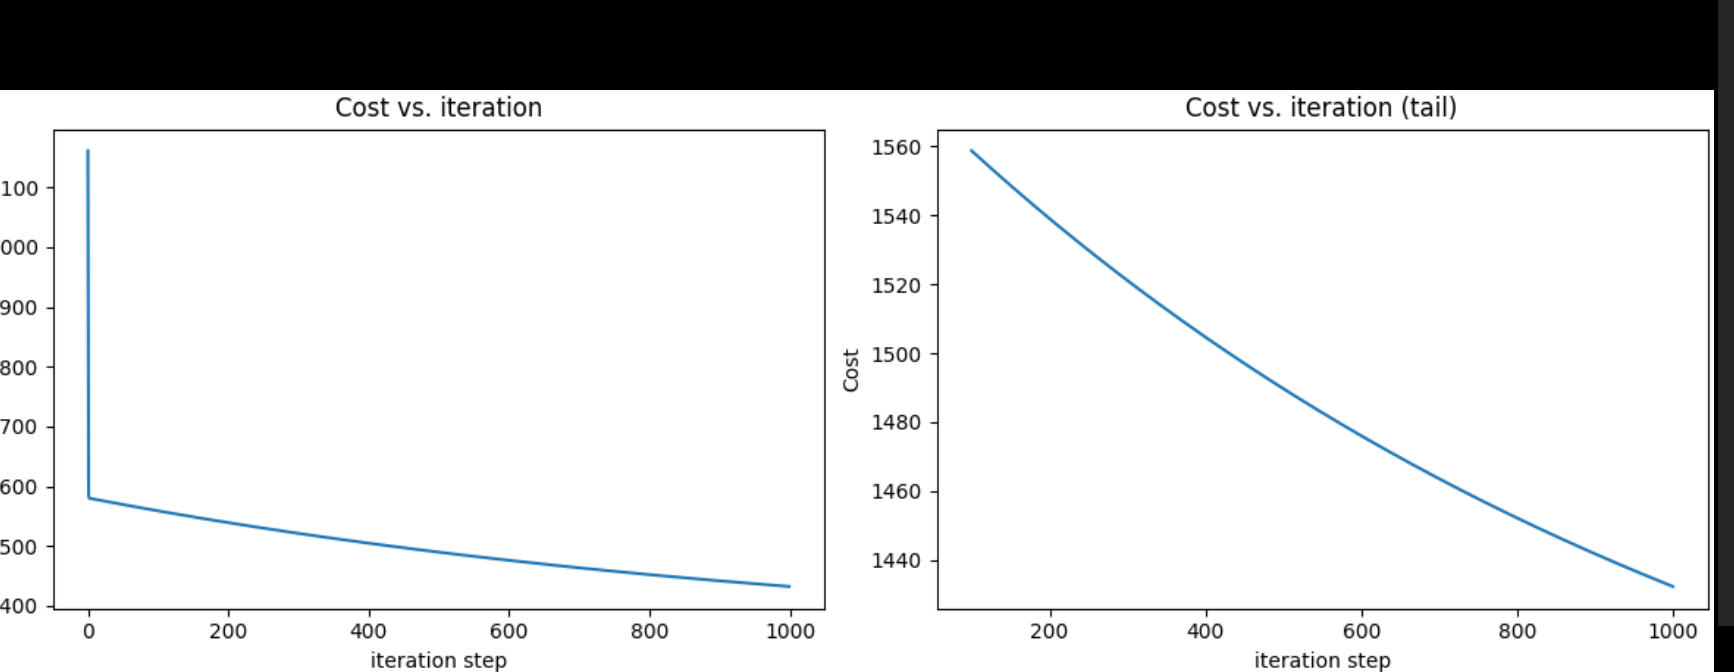
画出图像:

1
2
3
4
5
6
7
8
# plot cost versus iteration  
fig, (ax1, ax2) = plt.subplots(1, 2, constrained_layout=True, figsize=(12, 4))
ax1.plot(J_hist)
ax2.plot(100 + np.arange(len(J_hist[100:])), J_hist[100:])
ax1.set_title("Cost vs. iteration");  ax2.set_title("Cost vs. iteration (tail)")
ax1.set_ylabel('Cost')             ;  ax2.set_ylabel('Cost') 
ax1.set_xlabel('iteration step')   ;  ax2.set_xlabel('iteration step') 
plt.show()

20220711100547 20220711103631

可以看到,结果并不满意

完整代码:

  1
  2
  3
  4
  5
  6
  7
  8
  9
 10
 11
 12
 13
 14
 15
 16
 17
 18
 19
 20
 21
 22
 23
 24
 25
 26
 27
 28
 29
 30
 31
 32
 33
 34
 35
 36
 37
 38
 39
 40
 41
 42
 43
 44
 45
 46
 47
 48
 49
 50
 51
 52
 53
 54
 55
 56
 57
 58
 59
 60
 61
 62
 63
 64
 65
 66
 67
 68
 69
 70
 71
 72
 73
 74
 75
 76
 77
 78
 79
 80
 81
 82
 83
 84
 85
 86
 87
 88
 89
 90
 91
 92
 93
 94
 95
 96
 97
 98
 99
100
101
102
103
104
105
106
107
108
109
110
111
112
113
114
115
116
117
118
119
120
121
122
123
124
125
126
127
128
129
130
131
132
133
134
135
136
137
138
139
140
141
142
143
144
145
146
147
148
149
150
151
152
153
154
155
156
157
158
159
160
161
162
163
164
165
166
167
168
169
170
171
172
173
174
175
176
177
178
179
180
181
182
183
184
185
186
187
188
189
190
191
192
193
194
195
196
197
198
199
200
201
202
203
204
205
206
207
208
209
210
211
212
213
214
215
216
217
218
219
220
221
222
223
224
225
226
227
228
229
230
231
232
233
234
235
236
237
238
239
240
241
242
243
244
245
246
247
248
249
250
251
"""
多变量回归预测房价
训练样本在house.txt中,包含特征:size(sqrt)','bedrooms','floors','age'和'price'

"""
import math
import copy
import numpy as np
import matplotlib.pyplot as plt
np.set_printoptions(precision=2)


#
# def cat_data():
#     print("x:")
#     print(x_train.ndim)
#     print(type(x_train))
#     print(x_train.shape)
#     print("y:")
#     print(y_train.ndim)
#     print(type(y_train))
#     print(y_train.shape)


def compute_cost(X, y, w, b):
    """
    compute cost
    Args:
      X (ndarray (m,n)): Data, m examples with n features
      y (ndarray (m,)) : target values
      w (ndarray (n,)) : model parameters
      b (scalar)       : model parameter

    Returns:
      cost (scalar): cost
    """
    m = X.shape[0]
    cost = 0.0
    for i in range(m):
        f_wb_i = np.dot(X[i], w) + b  # (n,)(n,) = scalar (see np.dot)
        cost = cost + (f_wb_i - y[i]) ** 2  # scalar
    cost = cost / (2 * m)  # scalar
    return cost


def compute_gradient(X, y, w, b):
    """
    Computes the gradient for linear regression
    Args:
      X (ndarray (m,n)): Data, m examples with n features
      y (ndarray (m,)) : target values
      w (ndarray (n,)) : model parameters
      b (scalar)       : model parameter

    Returns:
      dj_dw (ndarray (n,)): The gradient of the cost w.r.t. the parameters w.
      dj_db (scalar):       The gradient of the cost w.r.t. the parameter b.
    """
    m, n = X.shape  # (number of examples, number of features)
    dj_dw = np.zeros((n,))
    dj_db = 0.

    for i in range(m):
        err = (np.dot(X[i], w) + b) - y[i]
        for j in range(n):
            dj_dw[j] = dj_dw[j] + err * X[i, j]
        dj_db = dj_db + err
    dj_dw = dj_dw / m
    dj_db = dj_db / m

    return dj_db, dj_dw


def gradient_descent(X, y, w_in, b_in, cost_function, gradient_function, alpha, num_iters):
    """
    Performs batch gradient descent to learn theta. Updates theta by taking
    num_iters gradient steps with learning rate alpha

    Args:
      X (ndarray (m,n))   : Data, m examples with n features
      y (ndarray (m,))    : target values
      w_in (ndarray (n,)) : initial model parameters
      b_in (scalar)       : initial model parameter
      cost_function       : function to compute cost
      gradient_function   : function to compute the gradient
      alpha (float)       : Learning rate
      num_iters (int)     : number of iterations to run gradient descent

    Returns:
      w (ndarray (n,)) : Updated values of parameters
      b (scalar)       : Updated value of parameter
      """

    # An array to store cost J and w's at each iteration primarily for graphing later
    J_history = []
    w = copy.deepcopy(w_in)  # avoid modifying global w within function
    b = b_in

    for i in range(num_iters):

        # Calculate the gradient and update the parameters
        dj_db, dj_dw = gradient_function(X, y, w, b)  ##None

        # Update Parameters using w, b, alpha and gradient
        w = w - alpha * dj_dw  ##None
        b = b - alpha * dj_db  ##None

        # Save cost J at each iteration
        if i < 100000:  # prevent resource exhaustion
            J_history.append(cost_function(X, y, w, b))

        # Print cost every at intervals 10 times or as many iterations if < 10
        if i % math.ceil(num_iters / 10) == 0:
            print(f"Iteration {i:4d}: Cost {J_history[-1]:8.2f}   ")

    return w, b, J_history  # return final w,b and J history for graphing


def zscore_normalize_features(X):
    """
    这里使用z-score进行特征缩放
    computes  X, zcore normalized by column

    Args:
      X (ndarray): Shape (m,n) input data, m examples, n features

    Returns:
      X_norm (ndarray): Shape (m,n)  input normalized by column
      mu (ndarray):     Shape (n,)   mean of each feature
      sigma (ndarray):  Shape (n,)   standard deviation of each feature
    """
    # find the mean of each column/feature
    mu = np.mean(X, axis=0)  # mu will have shape (n,)
    # find the standard deviation of each column/feature
    sigma = np.std(X, axis=0)  # sigma will have shape (n,)
    # element-wise, subtract mu for that column from each example, divide by std for that column
    X_norm = (X - mu) / sigma

    return (X_norm, mu, sigma)


if __name__ == '__main__':
    # 加载数据
    data = np.loadtxt("./data/houses.txt", delimiter=',', skiprows=1)
    X_train, y_train = data[:, :4], data[:, 4]
    # X_train = np.array([[2104, 5, 1, 45], [1416, 3, 2, 40], [852, 2, 1, 35]])
    # y_train = np.array([460, 232, 178])
    x_features = ['size(sqft)', 'bedrooms', 'floors', 'age']
    # cat_data()

    b_init = 785.1811367994083
    w_init = np.array([0.39133535, 18.75376741, -53.36032453, -26.42131618])
    # # Compute and display cost using our pre-chosen optimal parameters.
    # cost = compute_cost(X_train, y_train, w_init, b_init)
    # print(f'Cost at optimal w : {cost}')

    # # Compute and display gradient
    # tmp_dj_db, tmp_dj_dw = compute_gradient(X_train, y_train, w_init, b_init)
    # print(f'dj_db at initial w,b: {tmp_dj_db}')
    # print(f'dj_dw at initial w,b: \n {tmp_dj_dw}')

    # initialize parameters
    initial_w = np.zeros_like(w_init)
    initial_b = 0.
    # some gradient descent settings
    iterations = 1000
    # alpha = 1e-7
    alpha = 9e-7
    # run gradient descent
    w_final, b_final, J_hist = gradient_descent(X_train, y_train, initial_w, initial_b,
                                                compute_cost, compute_gradient,
                                                alpha, iterations)
    print(f"b,w found by gradient descent: {b_final:0.2f},{w_final} ")
    m, _ = X_train.shape
    for i in range(m):
        print(f"prediction: {np.dot(X_train[i], w_final) + b_final:0.2f}, target value: {y_train[i]}")

    # plot cost versus iteration
    # fig, (ax1, ax2) = plt.subplots(1, 2, constrained_layout=True, figsize=(12, 4))
    # ax1.plot(J_hist)
    # ax2.plot(100 + np.arange(len(J_hist[100:])), J_hist[100:])
    # ax1.set_title("Cost vs. iteration")
    # ax2.set_title("Cost vs. iteration (tail)")
    # ax1.set_ylabel('Cost')
    # ax2.set_ylabel('Cost')
    # ax1.set_xlabel('iteration step')
    # ax2.set_xlabel('iteration step')
    # plt.show()


    #  m = X_train.shape[0]
    # yp = np.zeros(m)
    # for i in range(m):
    # #     print(f"prediction: {np.dot(X_train[i], w_final) + b_final:0.2f}, target value: {y_train[i]}")
    #     yp[i] = np.dot(X_train[i], w_final) + b_final

    # # # plot predictions and targets versus original features
    # fig, ax = plt.subplots(1, 4, figsize=(12, 3), sharey=True)
    # for i in range(len(ax)):
    #     ax[i].scatter(X_train[:, i], y_train, label='target')
    #     ax[i].set_xlabel(x_features[i])
    #     ax[i].scatter(X_train[:, i], yp, color="#FF9300", label='predict')
    # ax[0].set_ylabel("Price")
    # ax[0].legend()
    # fig.suptitle("target versus prediction using z-score normalized model")
    # plt.show()


    mu = np.mean(X_train,axis=0)
    sigma = np.std(X_train,axis=0)
    X_mean = (X_train - mu)X_sigma
    # X_norm = (X_train - mu)/sigma
    X_norm, X_mu,  = zscore_normalize_features(X_train)
    w_norm, b_norm, hist = gradient_descent(X_norm, y_train, initial_w, initial_b, cost_function=compute_cost, gradient_function=compute_gradient,alpha=1.0e-1, num_iters=1000)

    # predict target using normalized features
    m = X_norm.shape[0]
    yp = np.zeros(m)
    for i in range(m):
        yp[i] = np.dot(X_norm[i], w_norm) + b_norm

    # plot predictions and targets versus original features
    fig, ax = plt.subplots(1, 4, figsize=(12, 3), sharey=True)
    for i in range(len(ax)):
        ax[i].scatter(X_train[:, i], y_train, label='target')
        ax[i].set_xlabel(x_features[i])
        ax[i].scatter(X_train[:, i], yp, color="#FF9300", label='predict')
    ax[0].set_ylabel("Price")
    ax[0].legend()
    fig.suptitle("target versus prediction using z-score normalized model")
    plt.show()


    # plot cost versus iteration
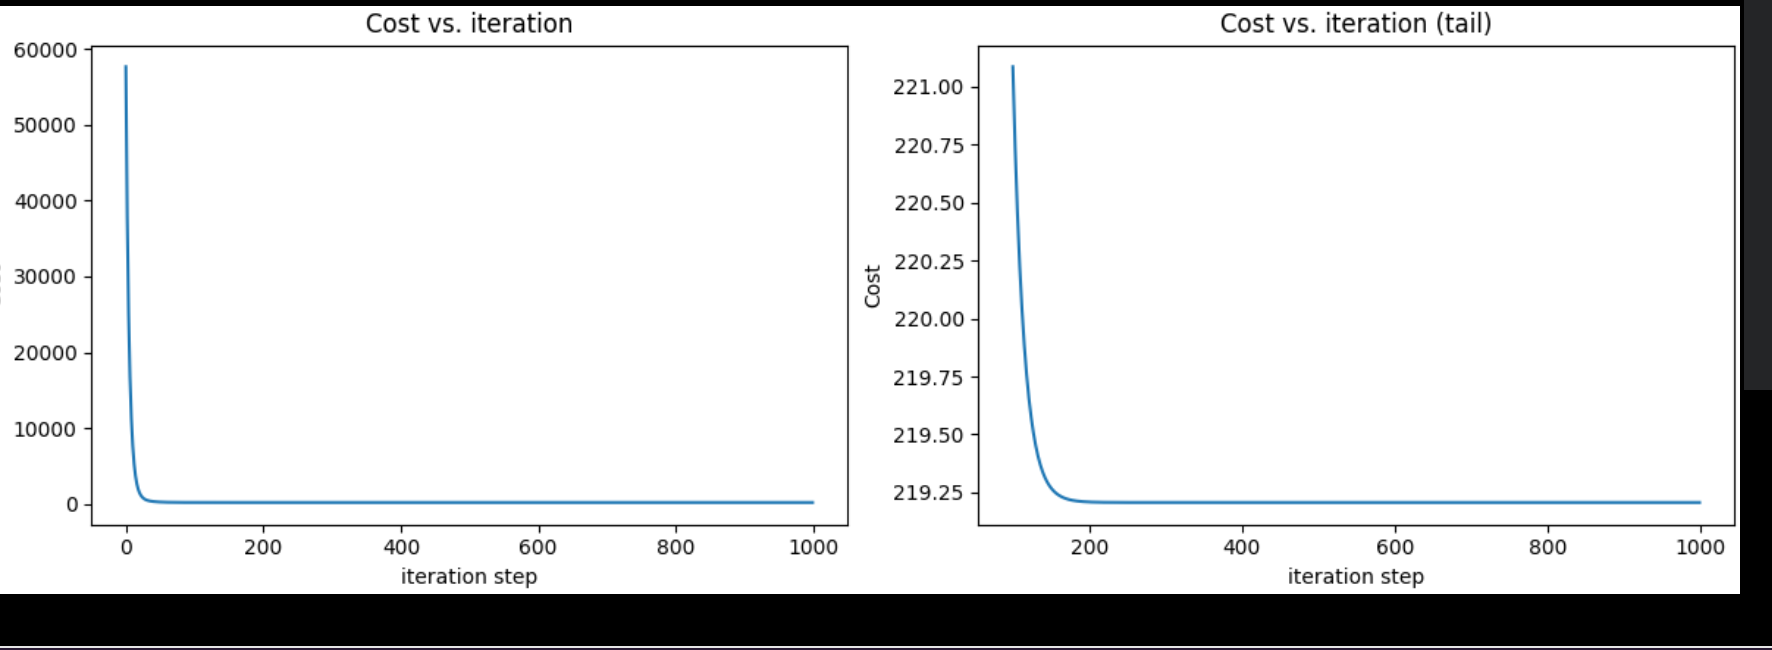
    fig, (ax1, ax2) = plt.subplots(1, 2, constrained_layout=True, figsize=(12, 4))
    ax1.plot(hist)
    ax2.plot(100 + np.arange(len(hist[100:])), hist[100:])
    ax1.set_title("Cost vs. iteration")
    ax2.set_title("Cost vs. iteration (tail)")
    ax1.set_ylabel('Cost')
    ax2.set_ylabel('Cost')
    ax1.set_xlabel('iteration step')
    ax2.set_xlabel('iteration step')
    plt.show()


    #
#

20220711103854

20220711103826

使用Scikit-Learn

 1
 2
 3
 4
 5
 6
 7
 8
 9
10
11
12
13
14
15
16
17
18
19
20
21
22
23
24
25
26
27
28
29
30
31
32
33
34
35
36
37
38
39
40
41
42
43
44
45
46
47
48
49
50
51
52
53
54
55
56
57
58
59
60
61
62
63
"""
多变量回归预测房价
训练样本在house.txt中,包含特征:size(sqrt)','bedrooms','floors','age'和'price'

"""
import numpy as np
import matplotlib.pyplot as plt
np.set_printoptions(precision=2)
from sklearn.linear_model import LinearRegression, SGDRegressor
from sklearn.preprocessing import StandardScaler


def main():
    # 加载数据
    data = np.loadtxt("./data/houses.txt", delimiter=',', skiprows=1)
    x_train, y_train = data[:, :4], data[:, 4]
    x_features = ['size(sqft)', 'bedrooms', 'floors', 'age']

    # 特征缩放/正则化
    scaler = StandardScaler()
    x_norm = scaler.fit_transform(x_train)
    print(f"Peak to Peak range by column in Raw        X:{np.ptp(x_train, axis=0)}")
    print(f"Peak to Peak range by column in Normalized X:{np.ptp(x_norm, axis=0)}")

    # 创建回归模型并fit(这里利用梯度下降进行拟合)
    sgdr = SGDRegressor(max_iter=1000)
    sgdr.fit(x_norm, y_train)
    print(sgdr)
    print(f"number of iterations completed: {sgdr.n_iter_}, number of weight updates: {sgdr.t_}")

    # 查看参数
    b_norm = sgdr.intercept_
    w_norm = sgdr.coef_
    print(f"model parameters:                   w: {w_norm}, b:{b_norm}")
    print(f"model parameters from previous lab: w: [110.56 -21.27 -32.71 -37.97], b: 363.16")

    # 进行预测
    # make a prediction using sgdr.predict()
    y_pred_sgd = sgdr.predict(x_norm)
    # make a prediction using w,b.
    y_pred = np.dot(x_norm, w_norm) + b_norm
    print(f"prediction using np.dot() and sgdr.predict match: {(y_pred == y_pred_sgd).all()}")

    print(f"Prediction on training set:\n{y_pred[:4]}")
    print(f"Target values \n{y_train[:4]}")


    # 绘制结果图像
    # plot predictions and targets vs original features
    dlorange = '#FF9300'
    fig, ax = plt.subplots(1, 4, figsize=(12, 3), sharey=True)
    for i in range(len(ax)):
        ax[i].scatter(x_train[:, i], y_train, label='target')
        ax[i].set_xlabel(x_features[i])
        ax[i].scatter(x_train[:, i], y_pred, color=dlorange, label='predict')
    ax[0].set_ylabel("Price")
    ax[0].legend()
    fig.suptitle("target versus prediction using z-score normalized model")
    plt.show()


if __name__ == '__main__':
    main()

20220711094700

好菜自己…自己还是不清晰

0%