Python之matplotlib学习

简介

Matplotlib 通常与 NumPy 和 SciPy(Scientific Python)一起使用, 这种组合广泛用于替代 MatLab,是一个强大的科学计算环境,有助于我们通过 Python 学习数据科学或者机器学习。

SciPy 是一个开源的 Python 算法库和数学工具包。

SciPy 包含的模块有最优化、线性代数、积分、插值、特殊函数、快速傅里叶变换、信号处理和图像处理、常微分方程求解和其他科学与工程中常用的计算。

matplotlib是Python最常用的绘图库,提供了一整套十分适合交互式绘图的命令,是非常强大的Python画图工具。

matplotlib可以画线图、散点图、等高线、图条形图、柱形图、3D图形、图形动画。

绘图基础知识

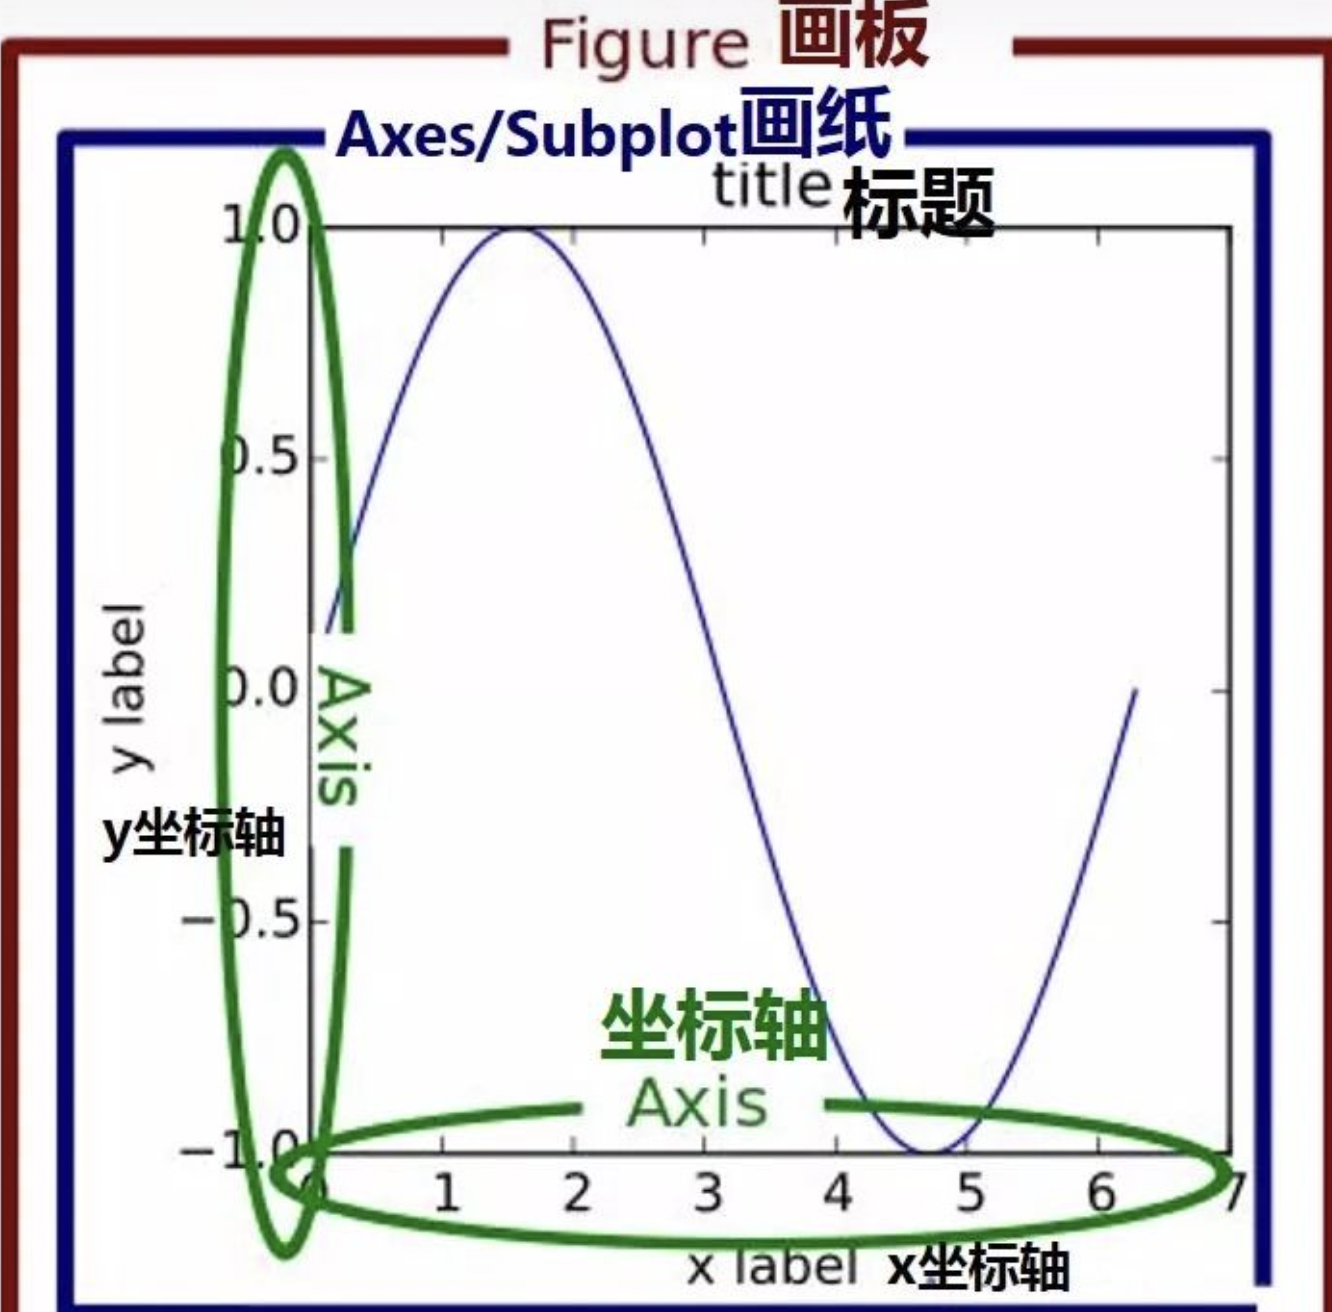
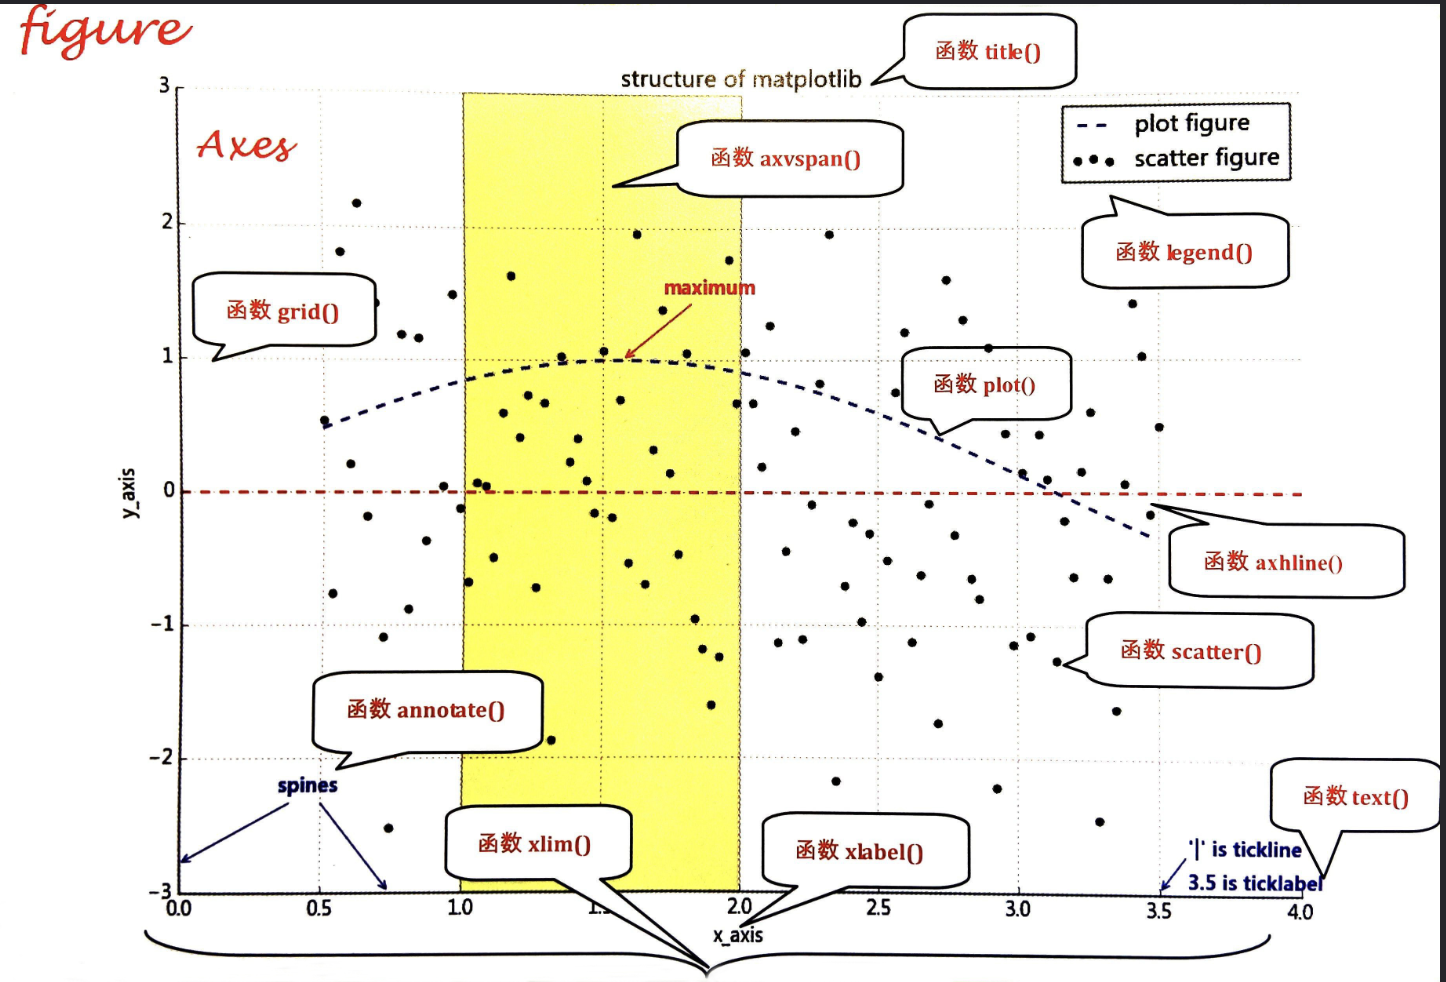
使用matplotlib绘图的原理,主要就是理解figure(画布)、axes(坐标系)、axis(坐标轴)三者之间的关系。

matplotlib中,就是需要指定axes(坐标系),每一个axes(坐标系)相当于一张画布上的一块区域。一张画布上,可以分配不同区域,也就是说,一张画布,可以指定多个axes(坐标系)。

特别注意:在matplotlib中,figure画布axes坐标轴并不能显示的看见,我们能够看到的就是一个axis坐标轴的各种图形。

  • 画板figure,画纸Sublpot画质,可多图绘画
  • 画纸上最上方是标题title,用来给图形起名字
  • 坐标轴Axis,横轴叫x坐标轴label,纵轴叫y坐标轴ylabel
  • 图例Legend 代表图形里的内容
  • 网格Grid,图形中的虚线,True显示网格
  • 点 Markers:表示点的形状。

https://geoer666-1257264766.cos.ap-beijing.myqcloud.com/matlib.png

https://geoer666-1257264766.cos.ap-beijing.myqcloud.com/matlib2.png

创建figure(画布)的方式

1.隐式

想要使用matplotlib绘图,必须要先创建一个figure(画布)对象,然后还要有axes(坐标系)。

当第一次执行画图代码时,系统会判断是否已经有了figure对象,如果没有,系统会自动创建一个figure对象,并且在这个figure至上,自动创建一个axes坐标系(注意:默认只创建一个figure对象,一个axes坐标系)。也就是说,如果我们不设置figure对象,那么一个figure对象上,只能有一个axes坐标系,即我们只能绘制一个图形。

**优势:**如果只是绘制一个小图形,那么直接使用plt.xxx()的方式,会自动帮我们创建一个figure对象和一个axes坐标系,这个图形最终就是绘制在这个axes坐标系之上的。

劣势:如果我们想要在一个figure对象上,绘制多个图形,那么我们就必须拿到每个个axes对象,然后调用每个位置上的axes对象,就可以在每个对应位置的坐标系上,进行绘图,如下图所示。注意:如果figure对象是被默认创建的,那么我们根本拿不到axes对象。因此,需要我们显示创建figure对象。

2.显式

1
2
3
4
5
6
7
import matplotlib.pyplot as plt

fig = plt.figure()

axes1 = fig.add_subplot(2,1,1)
axes2 = fig.add_subplot(2,1,2)
plt.show()

实例:

1
2
3
4
5
6
7
8
figure = plt.figure() # 先创建一个大图标
# 然后建立子图填充图标
# add_subplot中第一个参数是分割的行数,第二个参数是分割的列数,第三个参数是当前图所在的第几个位置,1代表第一个位置
axes1 = figure.add_subplot(2, 1, 1) 
axes2 = figure.add_subplot(2, 1, 2)
axes1.plot([1, 3, 5, 7], [4, 9, 6, 8])
axes2.plot(np.random.randn(50).cumsum())
figure.show()
subplot子图创建方法

方法1:先创建一个大图表 然后建立子图填充图表

 1
 2
 3
 4
 5
 6
 7
 8
 9
10
11
12
13
14
15
16
17
18
19
20
21
22
23
24
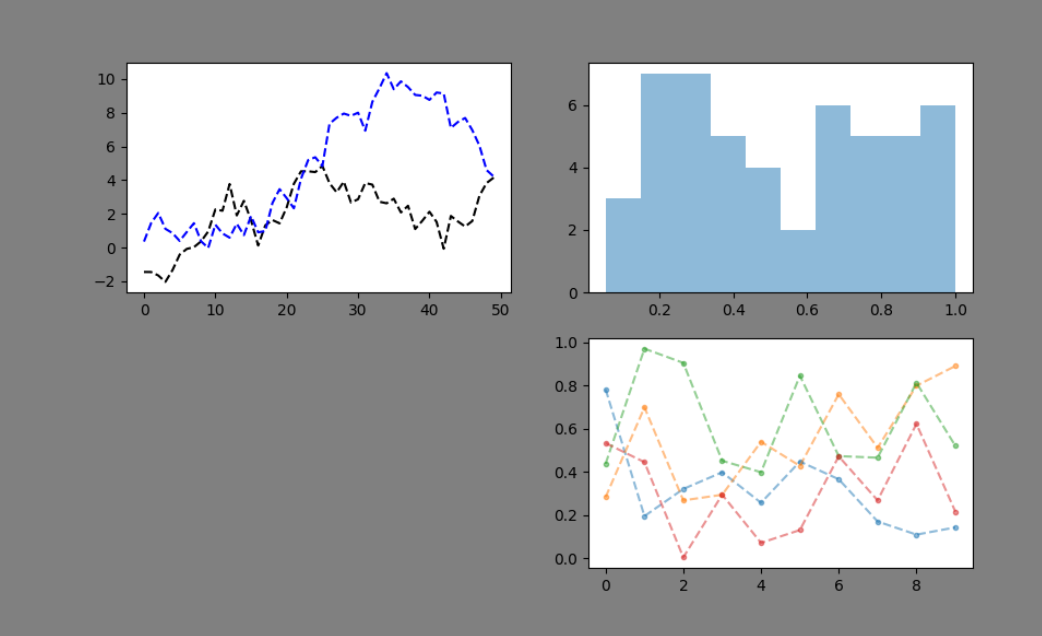
fig=plt.figure(figsize=(10,6),facecolor='gray')

ax1=fig.add_subplot(2,2,1) #在fig大图表里添加子图,第一行的左图
plt.plot(np.random.randn(50).cumsum(),'k--') #plot进行作图的时候只会跟最近的子图
plt.plot(np.random.randn(50).cumsum(),'b--')

ax2=fig.add_subplot(2,2,2) #第一行的右图
ax2.hist(np.random.rand(50),alpha=0.5)

ax4=fig.add_subplot(2,2,4) #第二行的右图
df2=pd.DataFrame(np.random.rand(10,4),columns=list('abcd'))
ax4.plot(df2,alpha=0.5,linestyle='--',marker='.')


# # 共享 x 轴
#plt.subplots(2, 2, sharex='col')
# 共享 y 轴
#plt.subplots(2, 2, sharey='row')
# 共享 x 轴和 y 轴
#plt.subplots(2, 2, sharex='all', sharey='all')
# 这个也是共享 x 轴和 y 轴
#plt.subplots(2, 2, sharex=True, sharey=True)
# 创建10 张图,已经存在的则删除
#fig, ax = plt.subplots(num=10, clear=True)

https://geoer666-1257264766.cos.ap-beijing.myqcloud.com/subplot_1.png

方法2:创建一个新的figure,并返回一个subplot对象的numpy数组 plt.subplot

 1
 2
 3
 4
 5
 6
 7
 8
 9
10
11
12
import matplotlib.pyplot as plt
import numpy as np
import pandas as pd

# figure = plt.figure()
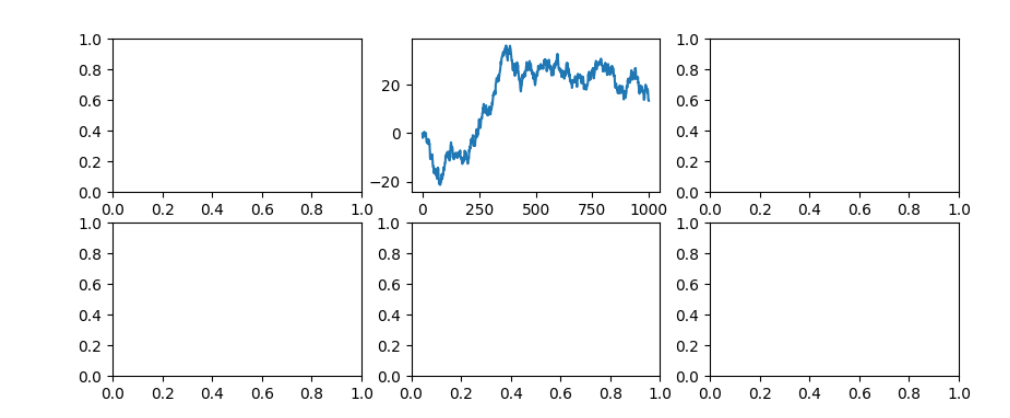
fig,axes=plt.subplots(2, 3, figsize=(10,4)) #创建一个2行3列的大图表
ts=pd.Series(np.random.randn(1000).cumsum())

ax1=axes[0,1] #确定ax1的位置在0行1列的位置
ax1.plot(ts) #ax1进行画图
# figure.show()
fig.show()

https://geoer666-1257264766.cos.ap-beijing.myqcloud.com/subplot_2.png

方法3:多系列图,分别绘制

 1
 2
 3
 4
 5
 6
 7
 8
 9
10
11
12
import matplotlib.pyplot as plt
import numpy as np
import pandas as pd

df=pd.DataFrame(np.random.randn(1000,4),columns=list('ABCD')).cumsum()

df.plot(style='--.',alpha=0.4,grid=True,figsize=(8,8),
subplots=True,
layout=(2,3),
sharex=True)

plt.subplots_adjust(wspace=0,hspace=0.2)

Matplotlib Pyplot

Pyplot 是 Matplotlib 的子库,提供了和 MATLAB 类似的绘图 API。

Pyplot 是常用的绘图模块,能很方便让用户绘制 2D 图表。

Pyplot 包含一系列绘图函数的相关函数,每个函数会对当前的图像进行一些修改,例如:给图像加上标记,生新的图像,在图像中产生新的绘图区域等等。

导入模块:

1
2
# 导入matplotlib模块pyplot的模块,并简写成plt
import matplotlib.pyplot as plt

可以调用pyplot模块的.plot方法绘制一些坐标,这个plot方法需要许多参数,但前两个是 “x” 和 “y” 坐标,放入列表。

plt.plot在后台[绘制]这个绘图,当绘制了我们想要的一切之后,需要把它带到屏幕上时,运用plt.show方法。

例子:通过两个坐标 (0,0)(6,100) 来绘制一条线

1
2
3
4
5
6
7
8
import matplotlib.pyplot as plt
import numpy as np

xpoints = np.array([0, 6])
ypoints = np.array([0, 100])

plt.plot(xpoints, ypoints)
plt.show()

plot() 用于画图它可以绘制点和线,语法格式如下:

 1
 2
 3
 4
 5
 6
 7
 8
 9
10
11
12
13
14
15
16
17
18
19
20
21
22
23
# 画单条线
plot([x], y, [fmt], *, data=None, **kwargs)
# 画多条线
plot([x], y, [fmt], [x2], y2, [fmt2], ..., **kwargs)

"""
参数说明:
x, y:点或线的节点,x 为 x 轴数据,y 为 y 轴数据,数据可以列表或数组。
fmt:可选,定义基本格式(如颜色、标记和线条样式)。
**kwargs:可选,用在二维平面图上,设置指定属性,如标签,线的宽度等。

>>> plot(x, y)        # 创建 y 中数据与 x 中对应值的二维线图,使用默认样式
>>> plot(x, y, 'bo')  # 创建 y 中数据与 x 中对应值的二维线图,使用蓝色实心圈绘制
>>> plot(y)           # x 的值为 0..N-1
>>> plot(y, 'r+')     # 使用红色 + 号

颜色字符:'b' 蓝色,'m' 洋红色,'g' 绿色,'y' 黄色,'r' 红色,'k' 黑色,'w' 白色,'c' 青绿色,'#008000' RGB 颜色符串。多条曲线不指定颜色时,会自动选择不同颜色。

线型参数:'‐' 实线,'‐‐' 破折线,'‐.' 点划线,':' 虚线。

标记字符:'.' 点标记,',' 像素标记(极小点),'o' 实心圈标记,'v' 倒三角标记,'^' 上三角标记,'>' 右三角标记,'<' 左三角标记...等等。

"""

如果我们只想绘制两个坐标点,而不是一条线,可以使用 o 参数,表示一个实心圈的标记:

1
2
3
4
5
6
7
8
import matplotlib.pyplot as plt
import numpy as np

xpoints = np.array([1, 8])
ypoints = np.array([3, 10])

plt.plot(xpoints, ypoints, 'o')
plt.show()

我们也可以绘制任意数量的点,只需确保两个轴上的点数相同即可。如:绘制一条不规则线,坐标为 (1, 3) 、 (2, 8) 、(6, 1) 、(8, 10),对应的两个数组为:[1, 2, 6, 8] 与 [3, 8, 1, 10]。

 1
 2
 3
 4
 5
 6
 7
 8
 9
10
import matplotlib.pyplot as plt
import numpy as np

xpoints = np.array([1, 2, 6, 8])
ypoints = np.array([3, 8, 1, 10])

plt.plot(xpoints, ypoints)
plt.show()

# 如果我们不指定 x 轴上的点,则 x 会根据 y 的值来设置为 0, 1, 2, 3..N-1。

完整的绘图步骤

1.导库

1
2
import matplotlib as mpl
import matplotlib.pyplot as plt

2.创建figure画布对象

1
2
3
2.1如果绘制一个简单的小图形我们可以不设置figure对象使用默认创建的figure对象当然我们也可以显示创建figure对象

2.2如果一张figure画布上需要绘制多个图形那么就必须显示的创建figure对象然后得到每个位置上的axes对象进行对应位置上的图形绘制

3.根据figure对象进行布局设置

4.获取对应位置子图的axes坐标系对象

1
2
3
figure = plt.figure()
axes1 = figure.add_subplot(2,1,1)
axes2 = figure.add_subplot(2,1,2)

5.调用axes对象,进行对应位置的图形绘制

1
2
这一步是我们传入数据进行绘图的一步
对于图形的一些细节设置都可以在这一步进行

6.显示图形

plt.show()figure.show(),如果在PyCharm中绘图的话,必须要加这句代码,才能显示。如果在notebook中进行绘图,可以不用加这句代码,而是自动显示。

绘制常见图形

常用统计图对比: 1、折线图:以折线的上升或下降来表示统计数量的增减变化的统计图

特点:能够显示数据的变化趋势,反映事物的变化情况。(变化)

2、直方图:由一系列高度不等的纵向条纹或线段表示数据分布的情况。一般用横轴表示数据范围,纵轴表示分布情况。

特点:绘制连续性的数据,展示一组或者多组数据的分布情况。(统计)

3、条形图:排列在工作表的列或行中的数据可以绘制到条形图中

特点:绘制连离散的数据,能够一眼看出各个数据的大小,比较数据之间的差别。(统计)

4、散点图:用两组数据构成多个坐标点,考察坐标点的分布,判断两变量之间是否存在某种关联或总结坐标点的分布模式。

特点:判断变量之间是否存在数量关联趋势,展示离群点。(分布规律)

折线图

基本图形:

1
2
3
4
5
6
7
8
from matplotlib import pyplot as plt

x = range(2, 26, 2)
y = [15, 13, 14.5, 17, 20, 25, 26, 26, 24, 22, 18, 15]
# 绘图
plt.plot(x, y)
# 展示图形
plt.show()

设置图片大小:

1
2
3
# 设置宽和高,dpi
plt.figure(figsize=(10, 5), dpi=80)
#在图像模糊的时候可以传入dpi参数,让图片更加清晰

保存图片:

1
2
#可以保存为svg这种矢量图格式,放大不会有锯齿
plt.savefig('./t1.png')

调整x或y轴上刻度:

1
2
3
4
#调整X轴刻度
plt.xticks(x)
#调整Y轴刻度
plt.yticks(y)

设置中文显示:

1
2
# 设置中文字体显示
matplotlib.rc("font", family='MicroSoft YaHei', weight='bold')

plot方法使用:

1
2
3
4
5
6
7
8
plt.plot(
	x,	#x轴数据
	y,	#y轴数据
	color='r',	#线条颜色
	linestyle='--',	#线条样式
	linewidth=5,	#线条粗细
	alpha=0.5	#透明度(0-1)
)

为每条线添加图例:

1
2
3
4
5
6
#通过label指定图例内容
plt.plot(range(len(y)),y,label='test', linestyle='--',color='red',alpha=0.5)

#通过loc指定图例位置,默认右上角
#'best', 'upper right', 'upper left', 'lower left', 'lower right', 'right', 'center left', 'center right', 'lower center', 'upper center', 'center'
plt.legend(loc='best)

添加图形描述:

1
2
3
4
5
6
# x轴标题
plt.xlabel("xxx")
# y轴标题
plt.ylabel("yyy")
# 图形标题
plt.title("My Picture")

绘制网格

1
plt.grid(alpha=0.4)

趋势图:

1
2
3
4
5
6
7
8
9
x = ['2000-01-03','2000-02-03','2000-03-03','2000-04-03']
# 定义y轴数据
y1 = [0,3,5,7]
y2 = [11,22,33,44]
plt.plot(x,y1,label='tempreature')
plt.plot(x,y2,label='water')
# 显示图例
plt.legend()
plt.show()

散点图

使用scatter绘制散点图

1
plt.scatter(x,y)	# 与绘制条形图的唯一区别
 1
 2
 3
 4
 5
 6
 7
 8
 9
10
11
12
# 用random模块获取两组数据,分别代表横纵坐标。一组数据里有50个数,
# 用随机种子的方法固定住random模块获取得到的数据
# 并将散点图里的符号变为'*'

import numpy as np
np.random.seed(10)  # 随机种子,将随机数固定住
heights = []
weights = []
heights.append(np.random.randint(150,185,size=50))
# weights.append(np.random.normal(loc=50,scale=100,size))  # 生成正太分布,也称高斯分布
weights.append(np.random.randint(50,100,size=50))
plt.scatter(heights,weights,marker='*',color='yellow')   #默认是圆点,marker='*'

设置散点图标大小:

1
2
3
4
5
6
7
8
9
import matplotlib.pyplot as plt
import numpy as np

x = np.array([1, 2, 3, 4, 5, 6, 7, 8])
y = np.array([1, 4, 9, 16, 7, 11, 23, 18])
sizes = np.array([20,50,100,200,500,1000,60,90])
plt.scatter(x, y, s=sizes)
# plt.scatter(x, y, s=area, c=colors, alpha=0.5) # 设置颜色及透明度
plt.show()

3D散点图

 1
 2
 3
 4
 5
 6
 7
 8
 9
10
x = np.random.randint(0,10,size=100)
y = np.random.randint(0,10,size=100)
z = np.random.randint(0,10,size=100)
# 创建二维对象
fig = plt.figure()
# 强转
axes3d = Axes3D(fig)
# 填充数据
axes3d.scatter(x,y,z)
plt.show()

条形图

使用bar绘制竖着的条形图

1
plt.bar(range(len(x)), y, width = 0.3, color = 'red')	# bar绘制条形图,只能接受含数字的可迭代对象 width表示线条粗细

使用barh绘制横着的条形图

1
plt.bar(range(len(a)), b, height = 0.3, color = 'red')

如:

 1
 2
 3
 4
 5
 6
 7
 8
 9
10
11
12
13
14
15
16
17
18
19
20
21
22
23
from matplotlib import pyplot as plt
import matplotlib

# 绘制电影票房前20条形图
matplotlib.rc("font", family="MicroSoft YaHei", size="8")
a = ["战狼2", "速度与激情8", "功夫瑜伽", "西游伏妖篇", "变形金刚5\n:最后的骑士", "摔跤吧\n!爸爸", "加勒比海盗5\n:死无对证", "金刚:\n骷髅岛", "极限特工\n:终极回归",
     "生化危机6\n:终章",
     "乘风破浪", "神偷奶爸3", "智取威虎山", "大闹天竺", "金刚狼3:\n殊死一战", "蜘蛛侠:\n英雄归来", "悟空传", "银河护卫队2", "情圣", "新木乃伊", ]
b = [56.01, 26.94, 17.53, 16.49, 15.45, 12.96, 11.8, 11.61, 11.28, 11.12, 10.49, 10.3, 8.75, 7.55, 7.32, 6.99, 6.88,
     6.86, 6.58, 6.23]
# 设置图形大小
plt.figure(figsize=(10, 7), dpi=80)
# 绘制条形图,设置线条粗细
plt.bar(range(len(a)), b, width=0.3)
# 设置字符串到x轴
plt.xticks(range(len(a)), a, rotation=90)
# 绘制图例信息
plt.xlabel("电影名称")
plt.ylabel("电影票房(单位:亿)")
plt.title("电影票房前20")
# 绘制网格
plt.grid(alpha=0.3)
plt.show()
1
2
3
4
5
6
price = [11,22,33,44]
plt.barh(range(4),price,align='center',color='red',alpha=0.5)
plt.xlabel('价格')
plt.yticks(range(4),['红楼梦','西游记','水浒传','三国演义'])
plt.title('四大名著')
plt.show()

bar

 1
 2
 3
 4
 5
 6
 7
 8
 9
10
11
12
13
14
15
16
17
18
import matplotlib
import matplotlib.pyplot as plt
import numpy as np
import pandas as pd


# 指定默认字体
# matplotlib.rcParams['font.sans-serif'] = ['SimHei']

# 第一个参数:索引
# 第二个参数:高度    参数必须对应否则报错
plt.bar(range(5), [100,200,300,400,500], color='red')
plt.xticks(range(5), ['A','B','C','D','E'])
plt.xlabel('name')
plt.ylabel('score')
plt.title('student score')# 或显示图标Plt.show()
plt.show()

自定义各个柱形的颜色:

1
2
3
4
5
6
7
8
import matplotlib.pyplot as plt
import numpy as np

x = np.array(["Runoob-1", "Runoob-2", "Runoob-3", "C-RUNOOB"])
y = np.array([12, 22, 6, 18])

plt.bar(x, y,  color = ["#4CAF50","red","hotpink","#556B2F"])
plt.show()

设置柱形图宽度,bar() 方法使用 width 设置,barh() 方法使用 height 设置 height

直方图

使用hist绘制直方图

1
2
plt.hist(a, b)	# 绘制频数直方图,a表示数据列表,b表示组数
plt.hist(a, b, density = True)	# 绘制频率直方图

如:

 1
 2
 3
 4
 5
 6
 7
 8
 9
10
11
12
13
14
15
16
17
18
19
20
21
22
23
24
from matplotlib import pyplot as plt
# 数据准备
a = [131, 98, 125, 131, 124, 139, 131, 117, 128, 108, 135, 138, 131, 102, 107, 114, 119, 128, 121, 142, 127, 130, 124,
     101, 110, 116, 117, 110, 128, 128, 115, 99, 136, 126, 134, 95, 138, 117, 111, 78, 132, 124, 113, 150, 110, 117, 86,
     95, 144, 105, 126, 130, 126, 130, 126, 116, 123, 106, 112, 138, 123, 86, 101, 99, 136, 123, 117, 119, 105, 137,
     123, 128, 125, 104, 109, 134, 125, 127, 105, 120, 107, 129, 116, 108, 132, 103, 136, 118, 102, 120, 114, 105, 115,
     132, 145, 119, 121, 112, 139, 125, 138, 109, 132, 134, 156, 106, 117, 127, 144, 139, 139, 119, 140, 83, 110, 102,
     123, 107, 143, 115, 136, 118, 139, 123, 112, 118, 125, 109, 119, 133, 112, 114, 122, 109, 106, 123, 116, 131, 127,
     115, 118, 112, 135, 115, 146, 137, 116, 103, 144, 83, 123, 111, 110, 111, 100, 154, 136, 100, 118, 119, 133, 134,
     106, 129, 126, 110, 111, 109, 141, 120, 117, 106, 149, 122, 122, 110, 118, 127, 121, 114, 125, 126, 114, 140, 103,
     130, 141, 117, 106, 114, 121, 114, 133, 137, 92, 121, 112, 146, 97, 137, 105, 98, 117, 112, 81, 97, 139, 113, 134,
     106, 144, 110, 137, 137, 111, 104, 117, 100, 111, 101, 110, 105, 129, 137, 112, 120, 113, 133, 112, 83, 94, 146,
     133, 101, 131, 116, 111, 84, 137, 115, 122, 106, 144, 109, 123, 116, 111, 111, 133, 150]
# 计算组数
d = 3  # 组距
num_bins = (max(a) - min(a)) // d  # 组数,取整
# 设置图形大小
plt.figure(figsize=(12, 5), dpi=80)
# plt.hist(a, num_bins)					# 频数
plt.hist(a, num_bins, density=True)		# 频率
# 设置x轴的刻度
plt.xticks(range(min(a), max(a) + d, d))
plt.grid()
plt.show()

饼图

1
2
3
4
labels = ['A','B','C','D']
# autopct='%1.1f%%'显示比列,格式化显示一位小数,固定写法
plt.pie([50,39,50,20],labels=labels,autopct='%1.1f%%')
plt.title('人口比例')

3D饼图突出展示

 1
 2
 3
 4
 5
 6
 7
 8
 9
10
11
12
13
14
15
16
17
def test_pie():
    beijing = [10,20,30,40]
    label = ['2-3年','3-4年','4-5年','5年']
    color = ['red','yellow','green','blue']
    indict = []
    for index,item in enumerate(beijing):
        # 判断优先级
        if item == max(beijing):
            indict.append(0.3)
        elif index == 1:
            indict.append(0.2)
        else:
            indict.append(0)
    plt.pie(beijing,labels=label,colors=color,startangle=90,shadow=True,explode=tuple(indict),autopct='%1.1f%%')
    plt.title('3D切割凸显饼图')
    plt.show()
test_pie()

面积图

 1
 2
 3
 4
 5
 6
 7
 8
 9
10
11
12
13
14
15
16
17
18
19
20
21
22
23
24
25
from matplotlib import pyplot as plt
import numpy as np
# 导入3D模块
from mpl_toolkits.mplot3d.axes3d import Axes3D
import matplotlib
#指定默认字体
matplotlib.rcParams['font.sans-serif'] = ['SimHei']
# 面积图
def test_area():
    date = ['2000-01-01','2000-02-01','2000-03-01','2000-04-01']
    earn = [156,356,156,30]
    eat = [10,20,30,40]
    drink = [20,20,30,40]
    play = [20,20,30,40]
#     [20,20,30,40]]
    plt.stackplot(date,earn,eat,drink,play,colors=['red','yellow','green','blue'])
    plt.title('收入支出面积图展示')
    plt.plot([],[],color='red',label='收入')
    plt.plot([],[],color='yellow',label='吃')
    plt.plot([],[],color='green',label='喝')
    plt.plot([],[],color='blue',label='玩')
    # 展示图例
    plt.legend()
    plt.show()
test_area()

箱型图

 1
 2
 3
 4
 5
 6
 7
 8
 9
10
11
12
13
14
15
16
17
18
19
20
21

# 读取数据集
df = pd.read_excel('tips.xlsx','sheet1')

# 绘制散点图证明推论:小费随着总账单的递增而递增
# df.plot(kind='scatter',x='tip',y='total_bill',c='red',label='bill_tip')


# 绘制箱型图
# 计算小费占总账单的比例
df['pct'] = df.tip / df.total_bill * 100
# print(df)
# 过滤出小费占比比较高的人群,例如:30%以上
print(df[df.pct > 30])
# 删除异常数据,按照索引删除
df = df.drop([67,172,178])
# print(df)
# 打印箱型图
df.pct.plot(kind='box',label='tips pct%')
# 绘制
plt.show()

常用函数

绘制图表组成元素的主要函数

plot()——展现量的变化趋势

 1
 2
 3
 4
 5
 6
 7
 8
 9
10
11
12
import matplotlib.pyplot as plt
import numpy as np
import pandas as pd


x = np.linspace(1, 10, 1000)
y = np.cos(x)

# ls 曲线类型  lw曲线粗细  lable 图例名称
plt.plot(x, y, ls="--", lw=5, label="plot figure")
plt.legend()
plt.show()

scatter()——寻找变量之间的关系

 1
 2
 3
 4
 5
 6
 7
 8
 9
10
11
12
#encoding=utf-8
import matplotlib.pyplot as plt
import numpy as np

x = np.linspace(1,10,1000)

y = np.random.rand(1000)

# ls 曲线类型  lw曲线粗细  lable 图例名称
plt.scatter(x,y,label="scatter figure")
plt.legend()
plt.show()

xlim()——设置x轴的数值显示范围

 1
 2
 3
 4
 5
 6
 7
 8
 9
10
11
12
13
14
#encoding=utf-8
import matplotlib.pyplot as plt
import numpy as np

x = np.linspace(1,10,1000)

y = np.random.rand(1000)

# ls 曲线类型  lw曲线粗细  lable 图例名称
plt.scatter(x,y,label="scatter figure")
plt.xlim(0.01,10)
plt.ylim(0,1)
plt.legend()
plt.show()

xlabel()——设置x轴的标签文本

 1
 2
 3
 4
 5
 6
 7
 8
 9
10
11
12
13
import numpy as np
import matplotlib.pyplot as plt
import matplotlib


x = np.linspace(0.05, 10, 1000)
y = np.sin(x)

plt.plot(x, y, ls="--", lw=2, c="c", label="plot figure")
plt.legend()
plt.xlabel("x-axis")
plt.ylabel("y-axis")
plt.show()

grid()——绘制刻度线的网格线

 1
 2
 3
 4
 5
 6
 7
 8
 9
10
11
12
import numpy as np
import matplotlib.pyplot as plt
import matplotlib


x = np.linspace(0.05, 10, 1000)
y = np.sin(x)

plt.plot(x, y, ls="--", lw=2, c="c", label="plot figure")
plt.legend()
plt.grid(linestyle="-",color="r")
plt.show()

axhline()——绘制平行于x轴的水平参考线

 1
 2
 3
 4
 5
 6
 7
 8
 9
10
11
12
13
import numpy as np
import matplotlib.pyplot as plt
import matplotlib


x = np.linspace(0.05, 10, 1000)
y = np.sin(x)

plt.plot(x, y, ls="--", lw=2, c="c", label="plot figure")
plt.legend()
plt.axhline(y=0.0,c="r",ls=":",lw=2)
plt.axvline(x=4.0,c="r",ls=":",lw=2)
plt.show()

axvspan()——绘制垂直于x轴的参考区域

 1
 2
 3
 4
 5
 6
 7
 8
 9
10
11
12
13
import numpy as np
import matplotlib.pyplot as plt
import matplotlib


x = np.linspace(0.05, 10, 1000)
y = np.sin(x)

plt.plot(x, y, ls="--", lw=2, c="c", label="plot figure")
plt.legend()
plt.axhspan(ymin=0.0,ymax=0.5,facecolor="y",alpha=0.3)
plt.axvspan(xmin=4.0,xmax=6.0,facecolor="y",alpha=0.3)
plt.show()

annotate()——添加图形内容细节的指向型注释文本

 1
 2
 3
 4
 5
 6
 7
 8
 9
10
11
12
13
14
15
16
17
18
19
20
21
import numpy as np
import matplotlib.pyplot as plt
import matplotlib


x = np.linspace(0.05, 10, 1000)
y = np.sin(x)

plt.plot(x, y, ls="--", lw=2, c="c", label="plot figure")
plt.legend()
plt.annotate(
    # 文字描述
    s = "maximum",
    # 设置xy坐标点
    xy=(np.pi / 2 ,1.0),
    xytext=((np.pi / 2) + 1.0, 0.8),
    weight="bold",
    c="b",
    arrowprops=dict(arrowstyle="->", connectionstyle="arc3", color="b"
))
plt.show()

text()——添加图形内容细节的无指向型注释文本

 1
 2
 3
 4
 5
 6
 7
 8
 9
10
11
12
13
14
15
16
17
18
19
20
21
22
23
import numpy as np
import matplotlib.pyplot as plt
import matplotlib


x = np.linspace(0.05, 10, 1000)
y = np.sin(x)

plt.plot(x, y, ls="--", lw=2, c="c", label="plot figure")
plt.legend()
plt.annotate(
    # 文字描述
    s = "maximum",
    # 设置xy坐标点
    xy=(np.pi/2,1.0),
    xytext=((np.pi / 2) + 1.0, 0.8),
    weight="bold",
    c="b",
    arrowprops=dict(arrowstyle="->", connectionstyle="arc3", color="b"
))
# text()
plt.text(x=3.10,y=0.09,s="y=sin(x)",weight="bold", c="b")
plt.show()

title()——添加图形内容的标题

 1
 2
 3
 4
 5
 6
 7
 8
 9
10
11
12
13
14
15
16
17
import numpy as np
import matplotlib.pyplot as plt
import matplotlib


x = np.linspace(0.05, 10, 1000)
y = np.sin(x)

plt.plot(x, y, ls="--", lw=2, c="c", label="plot figure")
plt.legend()
plt.title("center")
plt.title("left",loc="left",fontdict={"size": "xx-large",
                    "color": "r",
                    "family": "Times New Roman"})
plt.title("right",loc="right",family="Comic Sans MS", size=20,
          style="oblique", color="c")
plt.show()

legend()——表示不同图形的文本标签图例

 1
 2
 3
 4
 5
 6
 7
 8
 9
10
11
12
13
14
15
16
17
18
19
20
21
22
23
24
25
26
27
28
29
30
31
32
33
34
35
36
37
38
39
40
41
42
43
44
45
46
47
import numpy as np
import matplotlib.pyplot as plt
import matplotlib


x = np.arange(0,3,0.1)
y1 = np.power(x,3)
y2 = np.power(x,2)
y3 = np.power(x,1)

plt.plot(x,y1,c="r",ls="-", lw=2, label="$x^3$")
plt.plot(x,y2,c="b",ls="-", lw=2, label="$x^2$")
plt.plot(x,y3,c="y",ls="-", lw=2, label="$x^1$")

plt.legend(loc="upper left",fontsize="x-large",bbox_to_anchor=(0.05, 0.95), ncol=3,
           title="power function", shadow=True, fancybox=True)

plt.show()

"""
loc参数控制图例的位置,可选值为
best
upper right
upper left
lower left
lower right
right
center left
center right
lower center
upper center
center


ontsize控制图例字体大小,可选值为
int
float
xx-small
x-small
small
medium
large
x-large
xx-large

"""

常用配置参数

点标记类型

marker,只能用以下简写符号表示

marker 可以定义的符号如下:

标记 符号 描述
“.” m00
“,” m01 像素点
“o” m02 实心圆
“v” m03 下三角
“^” m04 上三角
“<” m05 左三角
“>” m06 右三角
“1” m07 下三叉
“2” m08 上三叉
“3” m09 左三叉
“4” m10 右三叉
“8” m11 八角形
“s” m12 正方形
“p” m13 五边形
“P” m23 加号(填充)
“*” m14 星号
“h” m15 六边形 1
“H” m16 六边形 2
“+” m17 加号
“x” m18 乘号 x
“X” m24 乘号 x (填充)
“D” m19 菱形
“d” m20 瘦菱形
“|” m21 竖线
“_” m22 横线
0 (TICKLEFT) m25 左横线
1 (TICKRIGHT) m26 右横线
2 (TICKUP) m27 上竖线
3 (TICKDOWN) m28 下竖线
4 (CARETLEFT) m29 左箭头
5 (CARETRIGHT) m30 右箭头
6 (CARETUP) m31 上箭头
7 (CARETDOWN) m32 下箭头
8 (CARETLEFTBASE) m33 左箭头 (中间点为基准)
9 (CARETRIGHTBASE) m34 右箭头 (中间点为基准)
10 (CARETUPBASE) m35 上箭头 (中间点为基准)
11 (CARETDOWNBASE) m36 下箭头 (中间点为基准)
“None”, " " or "" 没有任何标记
‘$…$’ m37 渲染指定的字符。例如 “$f$” 以字母 f 为标记。
1
2
3
4
5
6
7
import matplotlib.pyplot as plt
import numpy as np

ypoints = np.array([1,3,4,5,8,9,6,1,3,4,5,2,4])

plt.plot(ypoints, marker = '*')
plt.show()

我们也可以自定义标记的大小与颜色,使用的参数分别是:

  • markersize,简写为 ms:定义标记的大小。
  • markerfacecolor,简写为 mfc:定义标记内部的颜色。
  • markeredgecolor,简写为 mec:定义标记边框的颜色。
1
2
3
4
5
6
7
import matplotlib.pyplot as plt
import numpy as np

ypoints = np.array([6, 2, 13, 10])

plt.plot(ypoints, marker = 'o', ms = 20)
plt.show()

fmt 参数

fmt 参数定义了基本格式,如标记、线条样式和颜色。

1
fmt = '[marker][line][color]'

例如 o:ro 表示实心圆标记,: 表示虚线,r 表示颜色为红色。

1
2
3
4
5
6
7
import matplotlib.pyplot as plt
import numpy as np

ypoints = np.array([6, 2, 13, 10])

plt.plot(ypoints, 'o:r')
plt.show()

线类型:linestyle

线类型标记 描述
‘-’ 实线
‘:’ 虚线
‘–’ 破折线
‘-.’ 点划线

颜色类型:

颜色标记 描述
‘r’ 红色
‘g’ 绿色
‘b’ 蓝色
‘c’ 青色
’m' 品红
‘y’ 黄色
‘k’ 黑色
‘w’ 白色

也可以对关键字参数color赋十六进制的RGB字符串如 color=’#900302’

绘图线

线宽

线的宽度可以使用 linewidth 参数来定义,简写为 lw,值可以是浮点数,如:12.05.67 等。

1
2
3
4
5
6
7
import matplotlib.pyplot as plt
import numpy as np

ypoints = np.array([6, 2, 13, 10])

plt.plot(ypoints, linewidth = '12.5')
plt.show()

线类型

线类型:linestyle

1
2
3
4
5
6
7
8
9
import matplotlib.pyplot as plt
import numpy as np

ypoints = np.array([6, 2, 13, 10])

plt.plot(ypoints, linestyle = 'dotted')
# 简写
# plt.plot(ypoints, ls = '-.')
plt.show()

线的颜色

线的颜色可以使用 color 参数来定义,简写为 c

1
2
3
4
5
6
7
import matplotlib.pyplot as plt
import numpy as np

ypoints = np.array([6, 2, 13, 10])

plt.plot(ypoints, c = '#8FBC8F')
plt.show()

多条线

 1
 2
 3
 4
 5
 6
 7
 8
 9
10
import matplotlib.pyplot as plt
import numpy as np

y1 = np.array([3, 7, 5, 9])
y2 = np.array([6, 2, 13, 10])

plt.plot(y1)
plt.plot(y2)

plt.show()

多图

subplot()

subplot() 方法在绘图时需要指定位置

 1
 2
 3
 4
 5
 6
 7
 8
 9
10
11
12
13
14
15
16
17
18
19
20
21
22
23
24
25
26
27
28
29
30
31
32
33
34
35
36
37
mport matplotlib.pyplot as plt
import numpy as np

#plot 1:
x = np.array([0, 6])
y = np.array([0, 100])

plt.subplot(2, 2, 1)
plt.plot(x,y)
plt.title("plot 1")

#plot 2:
x = np.array([1, 2, 3, 4])
y = np.array([1, 4, 9, 16])

plt.subplot(2, 2, 2)
plt.plot(x,y)
plt.title("plot 2")

#plot 3:
x = np.array([1, 2, 3, 4])
y = np.array([3, 5, 7, 9])

plt.subplot(2, 2, 3)
plt.plot(x,y)
plt.title("plot 3")

#plot 4:
x = np.array([1, 2, 3, 4])
y = np.array([4, 5, 6, 7])

plt.subplot(2, 2, 4)
plt.plot(x,y)
plt.title("plot 4")

plt.suptitle("RUNOOB subplot Test")
plt.show()

subplots()

subplots() 方法可以一次生成多个,在调用时只需要调用生成对象的 ax 即可

 1
 2
 3
 4
 5
 6
 7
 8
 9
10
11
12
13
14
15
16
17
18
19
20
21
22
23
24
25
26
27
28
29
30
31
32
33
34
35
36
37
38
39
import matplotlib.pyplot as plt
import numpy as np

# 创建一些测试数据 -- 图1
x = np.linspace(0, 2*np.pi, 400)
y = np.sin(x**2)

# 创建一个画像和子图 -- 图2
fig, ax = plt.subplots()
ax.plot(x, y)
ax.set_title('Simple plot')

# 创建两个子图 -- 图3
f, (ax1, ax2) = plt.subplots(1, 2, sharey=True)
ax1.plot(x, y)
ax1.set_title('Sharing Y axis')
ax2.scatter(x, y)

# 创建四个子图 -- 图4
fig, axs = plt.subplots(2, 2, subplot_kw=dict(projection="polar"))
axs[0, 0].plot(x, y)
axs[1, 1].scatter(x, y)

# 共享 x 轴
plt.subplots(2, 2, sharex='col')

# 共享 y 轴
plt.subplots(2, 2, sharey='row')

# 共享 x 轴和 y 轴
plt.subplots(2, 2, sharex='all', sharey='all')

# 这个也是共享 x 轴和 y 轴
plt.subplots(2, 2, sharex=True, sharey=True)

# 创建10 张图,已经存在的则删除
fig, ax = plt.subplots(num=10, clear=True)

plt.show()

后记

一堂学下来,感觉很多东西乱糟糟的。个人感觉还是记住最基本的流程和最常用的,把常用的多动手练习,至于剩下的用到的时候再查。

0%