简介
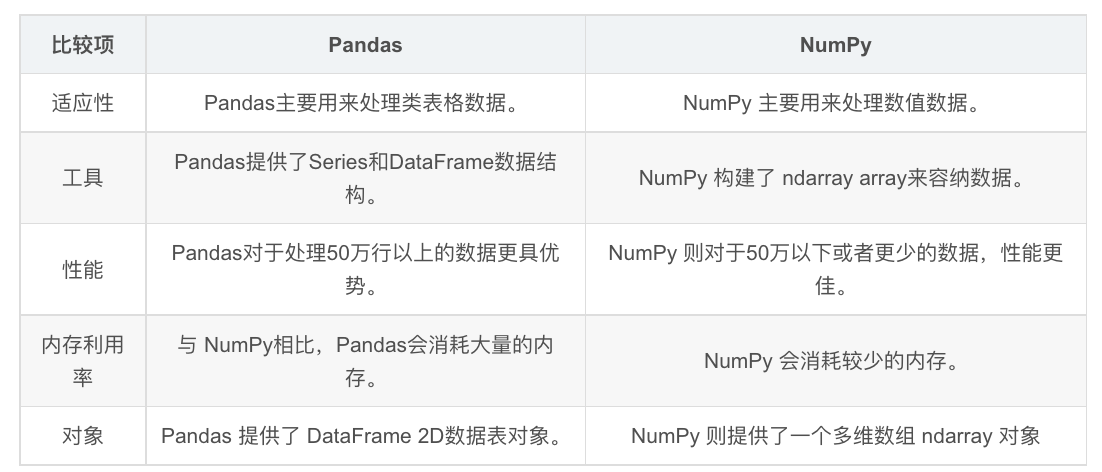
pandas是基于NumPy的一种数据分析工具,在机器学习任务中,我们首先需要对数据进行清洗和编辑等工作,pandas库大大简化了我们的工作量,熟练并掌握pandas常规用法是正确构建机器学习模型的第一步。
为什么要学习pandas?
所以,numpy能够帮助我们处理数值,但是pandas除了处理数值之外(基于numpy),还能够帮助我们处理其他类型的数据
① pandas一般解决表格型的数据、二维的。
② pandas是专门为处理表格和混杂数据设计的,而Numpy更适合处理统一数值数据。
③ pandas主要数据结构:Series 和 DataFrame
Pandas安装
导入包:
1
2
3
4
|
import numpy as np   # pandas和numpy常常结合在一起使用,导入numpy库
import pandas as pd # 官方推荐用别名pd

print(pd.__version__) # 打印pandas版本信息
|
一个简单的 pandas 实例:
 1
 2
 3
 4
 5
 6
 7
 8
 9
10
11
12
13
14
15
16
17
18
|
import pandas as pd

mydataset = {
  'sites': ["Google", "Runoob", "Wiki"],
  'number': [1, 2, 3]
}

myvar = pd.DataFrame(mydataset)

print(myvar)

"""
输出:
    sites  number
0  Google       1
1  Runoob       2
2    Wiki       3
"""
|
pandas数据类型
pandas包含两种数据类型:series和dataframe。
series
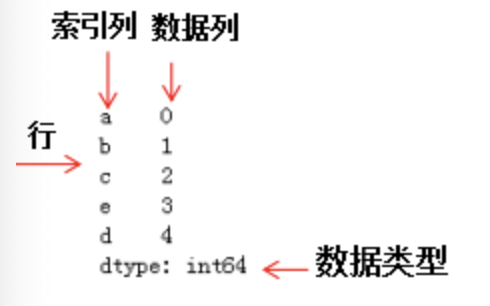
series是一种一维数据结构,每一个元素都带有一个索引,与一维数组的含义相似,可以保存任何数据类型。其中索引可以为数字或字符串。
series结构名称:|索引列|数据列

创建Series:
函数如下:
 1
 2
 3
 4
 5
 6
 7
 8
 9
10
|
pandas.Series(data, index, dtype, name, copy)

"""
参数说明:
data:一组数据(ndarray 类型)。
index:数据索引标签,如果不指定,默认从 0 开始。
dtype:数据类型,默认会自己判断。
name:设置名称。
copy:拷贝数据,默认为 False。
"""
|
1.创建一个空的Series对象
1
2
3
4
|
import pandas as pd
#输出数据为空
s = pd.Series()
print(s)
|
2.ndarray创建Series对象
ndarray 是 NumPy 中的数组类型,当 data 是 ndarry 时,传递的索引必须具有与数组相同的长度。假如没有给 index 参数传参,在默认情况下,索引值将使用是 range(n) 生成,其中 n 代表数组长度,如下所示:
 1
 2
 3
 4
 5
 6
 7
 8
 9
10
11
12
13
14
15
16
17
18
|
import pandas as pd
import numpy as np
data = np.array(['a','b','c','d'])
s = pd.Series(data) # 不指定索引,默认从0开始到len-1
# s = pd.Series(data,index=[100,101,102,103]) # “显式索引”的方法定义索引标签
# 命名索引列名称
s.name = 'alphabets'
print(s)

"""
输出
0   a
1   b
2   c
3   d
dtype: object

"""
|
3.dict创建Series对象
把 dict 作为输入数据。如果没有传入索引时会按照字典的键来构造索引;反之,当传递了索引时需要将索引标签与字典中的值一一对应。
3.1没有传递索引时:
1
2
3
4
5
|
import pandas as pd
import numpy as np
data = {'a' : 0., 'b' : 1., 'c' : 2.}
s = pd.Series(data)
print(s)
|
3.2为index参数传递索引时:
1
2
3
4
5
6
|
import pandas as pd
import numpy as np
data = {'a' : 0., 'b' : 1., 'c' : 2.}
s = pd.Series(data,index=['b','c','d','a'])
print(s)
# 当传递的索引值无法找到与其对应的值时,使用 NaN(非数字)填充。
|
如何从列表,数组,字典构建series:
 1
 2
 3
 4
 5
 6
 7
 8
 9
10
11
12
13
14
15
16
|
mylist = list('abcedfghijklmnopqrstuvwxyz')   # 列表
myarr = np.arange(26)                          # 数组
mydict = dict(zip(mylist, myarr))             # 字典(key变成了索引)

# 构建方法
ser1 = pd.Series(mylist)
ser2 = pd.Series(myarr)
ser3 = pd.Series(mydict)
print(ser3.head())                 # 打印前5个数据

    #>  a    0
    b    1
    c    2
    d    4
    e    3
    dtype:int64
|
4.标量创建Series对象
如果 data 是标量值,则必须提供索引
1
2
3
4
5
|
import pandas as pd
import numpy as np
s = pd.Series(5, index=[0, 1, 2, 3])
print(s)
# 标量值按照 index 的数量进行重复,并与其一一对应。
|
访问Series数据
1.位置索引访问
1
2
3
4
|
import pandas as pd
s = pd.Series([1,2,3,4,5],index = ['a','b','c','d','e'])
print(s[0])  #位置下标
print(s['a']) #标签下标
|
通过切片的方式访问 Series 序列中的数据,示例如下:
1
2
3
4
5
|
import pandas as pd
s = pd.Series([1,2,3,4,5],index = ['a','b','c','d','e'])
print(s[:3])
# 如果想要获取最后三个元素
print(s[-3:])
|
2.索引标签访问
 1
 2
 3
 4
 5
 6
 7
 8
 9
10
|
import pandas as pd
s = pd.Series([6,7,8,9,10],index = ['a','b','c','d','e'])

# 使用索标签访问单个元素值:
print(s['a'])

# 使用索标签访问多个元素值:
print(s[['a','c','d']])

# 如果使用了 index 中不包含的标签,则会触发异常:
|
Series常用属性
 1
 2
 3
 4
 5
 6
 7
 8
 9
10
|
"""
名称	属性
axes	以列表的形式返回所有行索引标签。
dtype	返回对象的数据类型。
empty	返回一个空的 Series 对象。返回一个布尔值,用于判断数据对象是否为空
ndim	返回输入数据的维数。根据定义,Series 是一维数据结构,因此它始终返回 1。
size	返回输入数据的元素数量。
values	以 ndarray 的形式返回 Series 对象。
index	返回一个RangeIndex对象,用来描述索引的取值范围。
"""
|
Series常用方法
1) head()&tail()查看数据
其中 head() 返回前 n 行数据,默认显示前 5 行数据;
tail() 返回的是后 n 行数据,默认为后 5 行。
1
2
3
|
print (s.head(3))

print (s.tail(2))
|
2) isnull()&nonull()检测缺失值
- isnull():如果值不存在或者缺失,则返回 True。
- notnull():如果值不存在或者缺失,则返回 False。
其它
如何使series的索引列转化为dataframe的列
 1
 2
 3
 4
 5
 6
 7
 8
 9
10
11
12
13
14
15
16
17
18
|
mylist = list('abcedfghijklmnopqrstuvwxyz')
myarr = np.arange(26)
mydict = dict(zip(mylist, myarr))
ser = pd.Series(mydict)

# series转换为dataframe
df = ser.to_frame()
# 索引列转换为dataframe的列

df.reset_index(inplace=True)
print(df.head())

#>      index  0
    0     a  0
    1     b  1
    2     c  2
    3     e  3
    4     d  4
|
结合多个series组成dataframe:
 1
 2
 3
 4
 5
 6
 7
 8
 9
10
11
12
13
14
15
16
17
18
19
|
# 构建series1
ser1 = pd.Series(list('abcedfghijklmnopqrstuvwxyz'))
# 构建series2
ser2 = pd.Series(np.arange(26))

# 方法1,axis=1表示列拼接,0表示行拼接
df = pd.concat([ser1, ser2], axis=1)

# 与方法1相比,方法2设置了列名

    df = pd.DataFrame({'col1': ser1, 'col2': ser2})
    print(df.head())

    #>      col1  col2
        0    a     0
        1    b     1
        2    c     2
        3    e     3
        4    d     4
|
获得series对象A中不包含series对象B的元素:
 1
 2
 3
 4
 5
 6
 7
 8
 9
10
11
12
13
|
ser1 = pd.Series([1, 2, 3, 4, 5])
ser2 = pd.Series([4, 5, 6, 7, 8])

# 返回ser1不包含ser2的布尔型series
ser3=~ser1.isin(ser2)

# 获取ser不包含ser2的元素
ser1[ser3]

#>    0    1
    1    2
    2    3
    dtype: int64
|
获得seriesA和seriesB不相同的项:
 1
 2
 3
 4
 5
 6
 7
 8
 9
10
11
12
13
14
15
16
17
18
|
ser1 = pd.Series([1, 2, 3, 4, 5])
ser2 = pd.Series([4, 5, 6, 7, 8])

# 求ser1和ser2的并集
ser_u = pd.Series(np.union1d(ser1, ser2))
# 求ser1和ser2的交集
ser_i = pd.Series(np.intersect1d(ser1, ser2))
# ser_i在ser_u的补集就是ser1和ser2不相同的项

ser_u[~ser_u.isin(ser_i)]

#>    0    1
    1    2
    2    3
    5    6
    6    7
    7    8
    dtype: int64
|
dataframe
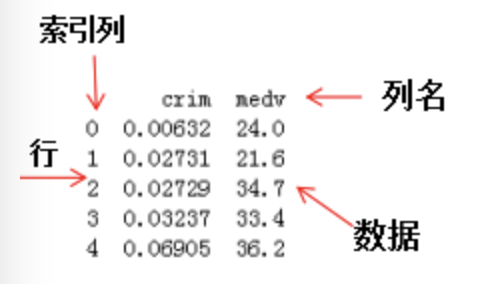
dataframe是一种二维数据结构,数据以表格形式(与excel类似)存储,有对应的行和列。DataFrame 既有行索引(index)也有列索引(columns),表格中每列的数据类型可以不同,比如可以是字符串、整型或者浮点型等。
DataFrame 的每一行数据都可以看成一个 Series 结构,只不过,DataFrame 为这些行中每个数据值增加了一个列标签。因此 DataFrame 其实是从 Series 的基础上演变而来。在数据分析任务中 DataFrame 的应用非常广泛,因为它描述数据的更为清晰、直观。
dataframe结构名称:

DataFrame 数据结构的特点简单总结:
DataFrame 每一列的标签值允许使用不同的数据类型;
DataFrame 是表格型的数据结构,具有行和列;
DataFrame 中的每个数据值都可以被修改。
DataFrame 结构的行数、列数允许增加或者删除;
DataFrame 有两个方向的标签轴,分别是行标签和列标签;
DataFrame 可以对行和列执行算术运算。
创建DataFrame对象
DataFrame 构造方法如下:
 1
 2
 3
 4
 5
 6
 7
 8
 9
10
11
12
|
pandas.DataFrame( data, index, columns, dtype, copy)


"""
参数说明:
data:一组数据(ndarray、series, map, lists, dict 等类型)。
index:索引值,或者可以称为行标签。
columns:列标签,默认为 RangeIndex (0, 1, 2, …, n) 。
dtype:数据类型。
copy:拷贝数据,默认为 False。

"""
|
主要有五种创建方式:
1.创建空的DataFame对象
1
2
3
|
import pandas as pd
df = pd.DataFrame()
print(df)
|
2.列表创建DataFame对象
单一列表创建 DataFrame:
1
2
3
4
|
import pandas as pd
data = [1,2,3,4,5]
df = pd.DataFrame(data)
print(df)
|
使用嵌套列表创建 DataFrame 对象:
1
2
3
4
5
6
|
import pandas as pd

data = [['Google',10],['Runoob',12],['Wiki',13]]
#df = pd.DataFrame(data, columns=['Site','Age'])
df = pd.DataFrame(data, columns=['Site','Age'], dtype=float) # 可以执行数值元素类型
print(df)
|
3.字典创建
data 字典中,键对应的值的元素长度必须相同(也就是列表长度相同)。如果传递了索引,那么索引的长度应该等于数组的长度;如果没有传递索引,那么默认情况下,索引将是 range(n),其中 n 代表数组长度。
字典嵌套列表(ndarrays)创建:
1
2
3
4
5
6
7
|
import pandas as pd
data = {'Name':['Tom', 'Jack', 'Steve', 'Ricky'],'Age':[28,34,29,42]}
df = pd.DataFrame(data)
# 也可以添加自定义的行标签(index 参数为每行分配了一个索引)
#df = pd.DataFrame(data, index=['rank1','rank2','rank3','rank4'])

print(df)
|
4.列表嵌套字典创建DataFrame对象
列表嵌套字典可以作为输入数据传递给 DataFrame 构造函数。默认情况下,字典的键被用作列名。
1
2
3
4
5
6
|
import pandas as pd

data = [{'a': 1, 'b': 2},{'a': 5, 'b': 10, 'c': 20}]
df = pd.DataFrame(data)
# df = pd.DataFrame(data, index=['first', 'second'], columns=['a', 'b1']) # 添加自定义行标签索引,列索引
print(df) # 没有对应的部分数据为 NaN。
|
5.Series创建DataFrame对象
1
2
3
4
5
6
7
|
import pandas as pd

d = {'one' : pd.Series([1, 2, 3], index=['a', 'b', 'c']),
   'two' : pd.Series([1, 2, 3, 4], index=['a', 'b', 'c', 'd'])}
df = pd.DataFrame(d)
print(df)
# 其输出结果的行索引是所有 index 的合集
|
列索引操作DataFrame
使用列索(columns index)引来完成数据的选取、添加和删除操作。
1.列索引选取数据列
1
2
3
4
5
6
|
import pandas as pd

d = {'one' : pd.Series([1, 2, 3], index=['a', 'b', 'c']),
   'two' : pd.Series([1, 2, 3, 4], index=['a', 'b', 'c', 'd'])}
df = pd.DataFrame(d)
print(df['one']) # 只提取one列的数据
|
2.列索引添加数据列
 1
 2
 3
 4
 5
 6
 7
 8
 9
10
11
12
13
14
15
16
17
|
import pandas as pd
d = {'one' : pd.Series([1, 2, 3], index=['a', 'b', 'c']),
   'two' : pd.Series([1, 2, 3, 4], index=['a', 'b', 'c', 'd'])}
df = pd.DataFrame(d)
# F1:使用df['列']=值方式,插入新的数据列
df['three']=pd.Series([10,20,30],index=['a','b','c'])
print(df)
#将已经存在的数据列做相加运算
df['four']=df['one']+df['three']
print(df)


# F2:使用insert()插入新的列
# 注意是column参数
# 数值1代表插入到columns列表的索引位置
df.insert(1,column='score',value=[91,90,75])
print(df)
|
2.列索引删除数据列
 1
 2
 3
 4
 5
 6
 7
 8
 9
10
11
12
13
14
15
|
# 通过 del 和 pop() 都能够删除 DataFrame 中的数据列。

import pandas as pd
d = {'one' : pd.Series([1, 2, 3], index=['a', 'b', 'c']),
   'two' : pd.Series([1, 2, 3, 4], index=['a', 'b', 'c', 'd']),
   'three' : pd.Series([10,20,30], index=['a','b','c'])}
df = pd.DataFrame(d)
print ("Our dataframe is:")
print(df)
#使用del删除
del df['one']
print(df)
#使用pop方法删除
df.pop('two')
print (df)
|
行索引操作DataFrame
跟上述的列标签操作类似
1.标签索引选取
可以使用 loc 属性返回指定行的数据。
1
2
3
4
5
6
|
import pandas as pd
d = {'one' : pd.Series([1, 2, 3], index=['a', 'b', 'c']),
   'two' : pd.Series([1, 2, 3, 4], index=['a', 'b', 'c', 'd'])}
df = pd.DataFrame(d)
print(df.loc['b'])
# loc 允许接两个参数分别是行和列,参数之间需要使用“逗号”隔开,但该函数只能接收标签索引。
|
2.整数索引选取
使用iloc
通过索引位置来选取,如果没有设置索引,默认第一行索引为 0,第二行索引为 1,以此类推:
1
2
3
4
5
6
|
import pandas as pd
d = {'one' : pd.Series([1, 2, 3], index=['a', 'b', 'c']),
   'two' : pd.Series([1, 2, 3, 4], index=['a', 'b', 'c', 'd'])}
df = pd.DataFrame(d)
print (df.iloc[2])
# iloc 允许接受两个参数分别是行和列,参数之间使用“逗号”隔开,但该函数只能接收整数索引
|
3.切片操作多行选取
1
2
3
4
5
6
|
import pandas as pd
d = {'one' : pd.Series([1, 2, 3], index=['a', 'b', 'c']),
   'two' : pd.Series([1, 2, 3, 4], index=['a', 'b', 'c', 'd'])}
df = pd.DataFrame(d)
#左闭右开
print(df[2:4])
|
4.添加数据行
使用 append() 函数,可以将新的数据行添加到 DataFrame 中,该函数会在行末追加数据行
1
2
3
4
5
6
|
import pandas as pd
df = pd.DataFrame([[1, 2], [3, 4]], columns = ['a','b'])
df2 = pd.DataFrame([[5, 6], [7, 8]], columns = ['a','b'])
#在行末追加新数据行
df = df.append(df2)
print(df)
|
5.删除数据行
 1
 2
 3
 4
 5
 6
 7
 8
 9
10
|
# 您可以使用行索引标签,从 DataFrame 中删除某一行数据。如果索引标签存在重复,那么它们将被一起删除。

import pandas as pd
df = pd.DataFrame([[1, 2], [3, 4]], columns = ['a','b'])
df2 = pd.DataFrame([[5, 6], [7, 8]], columns = ['a','b'])
df = df.append(df2)
print(df)
#注意此处调用了drop()方法
df = df.drop(0)
print (df)
|
常用属性和方法汇总
 1
 2
 3
 4
 5
 6
 7
 8
 9
10
11
12
|
名称	属性&方法描述
T	行和列转置。
axes	返回一个仅以行轴标签和列轴标签为成员的列表。
dtypes	返回每列数据的数据类型。
empty	DataFrame中没有数据或者任意坐标轴的长度为0,则返回True。
ndim	轴的数量,也指数组的维数。
shape	返回一个元组,表示了 DataFrame 维度。
size	DataFrame中的元素数量。
values	使用 numpy 数组表示 DataFrame 中的元素值。
head()	返回前 n 行数据。
tail()	返回后 n 行数据。
shift()	将行或列移动指定的步幅长度
|
T转置:
1
2
3
4
5
6
7
8
9
|
import pandas as pd
import numpy as np
d = {'Name':pd.Series(['c语言中文网','编程帮',"百度",'360搜索','谷歌','微学苑','Bing搜索']),
   'years':pd.Series([5,6,15,28,3,19,23]),
   'Rating':pd.Series([4.23,3.24,3.98,2.56,3.20,4.6,3.8])}
#构建DataFrame
df = pd.DataFrame(d)
#输出DataFrame的转置
print(df.T)
|
axes:
1
2
3
4
5
6
7
8
9
|
import pandas as pd
import numpy as np
d = {'Name':pd.Series(['c语言中文网','编程帮',"百度",'360搜索','谷歌','微学苑','Bing搜索']),
   'years':pd.Series([5,6,15,28,3,19,23]),
   'Rating':pd.Series([4.23,3.24,3.98,2.56,3.20,4.6,3.8])}
#构建DataFrame
df = pd.DataFrame(d)
#输出行、列标签
print(df.axes)
|
shape:
 1
 2
 3
 4
 5
 6
 7
 8
 9
10
11
12
|
# 返回一个代表 DataFrame 维度的元组。返回值元组 (a,b),其中 a 表示行数,b 表示列数。

import pandas as pd
import numpy as np
d = {'Name':pd.Series(['c语言中文网','编程帮',"百度",'360搜索','谷歌','微学苑','Bing搜索']),
   'years':pd.Series([5,6,15,28,3,19,23]),
   'Rating':pd.Series([4.23,3.24,3.98,2.56,3.20,4.6,3.8])}
#构建DataFrame
df = pd.DataFrame(d)
#DataFrame的形状
print(df.shape)
输出结果:
|
size:
 1
 2
 3
 4
 5
 6
 7
 8
 9
10
|
# 返回 DataFrame 中的元素数量
import pandas as pd
import numpy as np
d = {'Name':pd.Series(['c语言中文网','编程帮',"百度",'360搜索','谷歌','微学苑','Bing搜索']),
   'years':pd.Series([5,6,15,28,3,19,23]),
   'Rating':pd.Series([4.23,3.24,3.98,2.56,3.20,4.6,3.8])}
#构建DataFrame
df = pd.DataFrame(d)
#DataFrame的中元素个数
print(df.size)
|
values:
1
2
3
4
5
6
7
8
9
|
import pandas as pd
import numpy as np
d = {'Name':pd.Series(['c语言中文网','编程帮',"百度",'360搜索','谷歌','微学苑','Bing搜索']),
   'years':pd.Series([5,6,15,28,3,19,23]),
   'Rating':pd.Series([4.23,3.24,3.98,2.56,3.20,4.6,3.8])}
#构建DataFrame
df = pd.DataFrame(d)
#DataFrame的数据
print(df.values)
|
shift()移动行或列:
 1
 2
 3
 4
 5
 6
 7
 8
 9
10
11
12
13
14
15
16
17
18
19
20
21
22
23
24
25
|
"""
DataFrame.shift(periods=1, freq=None, axis=0)

参数名称	说明
peroids	类型为int,表示移动的幅度,可以是正数,也可以是负数,默认值为1。
freq	日期偏移量,默认值为None,适用于时间序。取值为符合时间规则的字符串。
axis	如果是 0 或者 “index” 表示上下移动,如果是 1 或者 “columns” 则会左右移动。
fill_value	该参数用来填充缺失值。

该函数的返回值是移动后的 DataFrame 副本
"""

import pandas as pd

import pandas as pd
info= pd.DataFrame({'a_data': [40, 28, 39, 32, 18],
'b_data': [20, 37, 41, 35, 45],
'c_data': [22, 17, 11, 25, 15]})

# print(info)
#移动幅度为3
# print(info.shift(periods=3))
#将缺失值和原数值替换为52
print(info.shift(periods=3,axis=0,fill_value=52))
# print(info.shift(periods=2,axis=1,fill_value=52))
|
Pandas描述性统计
常用的统计函数:
 1
 2
 3
 4
 5
 6
 7
 8
 9
10
11
12
13
14
15
16
|
"""
函数名称	描述说明
count()	统计某个非空值的数量。
sum()	求和
mean()	求均值
median()	求中位数
mode()	求众数
std()	求标准差
min()	求最小值
max()	求最大值
abs()	求绝对值
prod()	求所有数值的乘积。
cumsum()	计算累计和,axis=0,按照行累加;axis=1,按照列累加。
cumprod()	计算累计积,axis=0,按照行累积;axis=1,按照列累积。
corr()	计算数列或变量之间的相关系数,取值-1到1,值越大表示关联性越强。
"""
|
在 DataFrame 中,使用聚合类方法时需要指定轴(axis)参数。下面介绍两种传参方式:
- 对行操作,默认使用 axis=0 或者使用 “index”;
- 对列操作,默认使用 axis=1 或者使用 “columns”。
如sum()求和:默认情况下,返回axis=0上数值的和
 1
 2
 3
 4
 5
 6
 7
 8
 9
10
11
12
13
14
|
import pandas as pd
import numpy as np
#创建字典型series结构
d = {'Name':pd.Series(['小明','小亮','小红','小华','老赵','小曹','小陈',
   '老李','老王','小冯','小何','老张']),
   'Age':pd.Series([25,26,25,23,30,29,23,34,40,30,51,46]),
   'Rating':pd.Series([4.23,3.24,3.98,2.56,3.20,4.6,3.8,3.78,2.98,4.80,4.10,3.65])
}
df = pd.DataFrame(d)
#默认axis=0或者使用sum("index")
print(df.sum())
# axis为1的情况
#也可使用sum("columns")或sum(1)
print(df.sum(axis=1))
|
describe() 函数显示与 DataFrame 数据列相关的统计信息摘要。示例如下:
 1
 2
 3
 4
 5
 6
 7
 8
 9
10
11
12
13
14
15
16
|
import pandas as pd
import numpy as np
d = {'Name':pd.Series(['小明','小亮','小红','小华','老赵','小曹','小陈',
   '老李','老王','小冯','小何','老张']),
   'Age':pd.Series([25,26,25,23,30,29,23,34,40,30,51,46]),
   'Rating':pd.Series([4.23,3.24,3.98,2.56,3.20,4.6,3.8,3.78,2.98,4.80,4.10,3.65])
}
#创建DataFrame对象
df = pd.DataFrame(d)
#求出数据的所有描述信息
print(df.describe())
# 也可以使用include进行筛选:
#object: 表示对字符列进行统计信息描述;
#number:表示对数字列进行统计信息描述;
#all:汇总所有列的统计信息。
print(df.describe(include=["object"]))
|
Pandas绘图
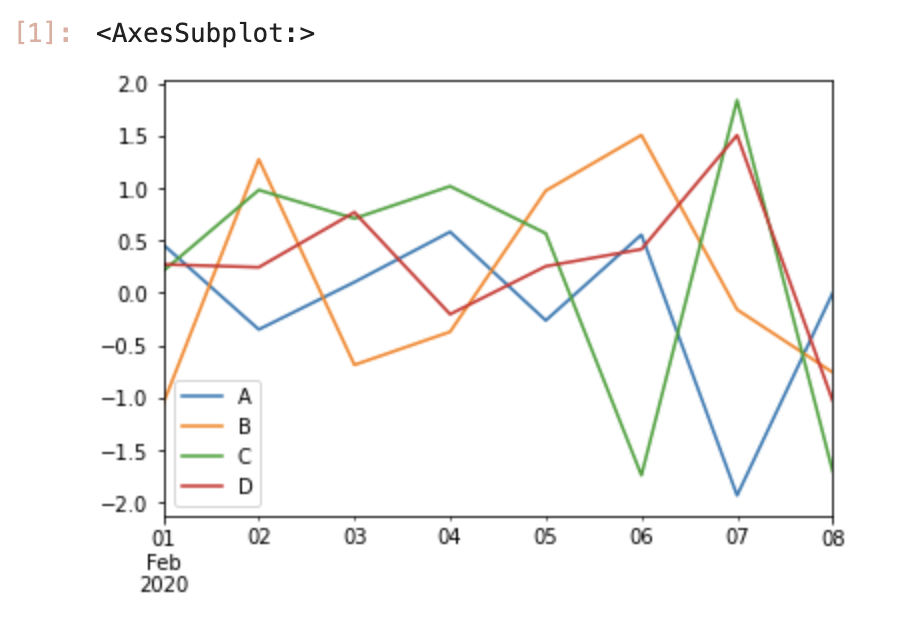
Pandas 对 Matplotlib 绘图软件包的基础上单独封装了一个plot()接口,通过调用该接口可以实现常用的绘图操作。
Pandas 之所以能够实现了数据可视化,主要利用了 Matplotlib 库的 plot() 方法,它对 plot() 方法做了简单的封装,因此您可以直接调用该接口。
所以提前也应该安装matplotlib库。
例子:
 1
 2
 3
 4
 5
 6
 7
 8
 9
10
11
12
13
14
15
16
17
18
19
20
|
import pandas as pd
import numpy as np

# 创建包含时间序列的数据
df = pd.DataFrame(np.random.randn(8, 4), index=pd.date_range('2/1/2020', periods=8), columns=list('ABCD'))
# df.plot()
print(df)

"""
数据如下:
                   A         B         C         D
2020-02-01  0.437235 -0.340243  0.453327 -0.086441
2020-02-02 -0.659249  0.560961  2.044332 -0.802733
2020-02-03 -1.340092 -0.189921 -0.293884  1.505851
2020-02-04 -1.024036 -0.022197 -1.004789 -0.562610
2020-02-05  0.530465 -0.584053 -0.066200  0.585188
2020-02-06 -0.169236  1.131713 -0.773533  0.206311
2020-02-07  0.583019  0.002341 -0.518091 -1.449647
2020-02-08  1.079004 -1.023189  0.714075  0.353996
"""
|

如果行索引中包含日期,Pandas 会自动调用 gct().autofmt_xdate() 来格式化 x 轴。
除了使用默认的线条绘图外,您还可以使用其他绘图方式,如下所示:
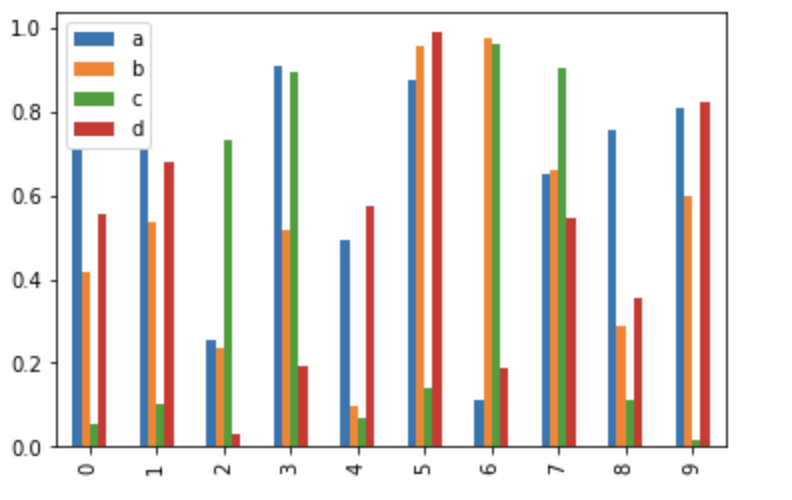
柱状图:bar() 或 barh()
直方图:hist()
箱状箱:box()
区域图:area()
散点图:scatter()
通过关键字参数kind可以把上述方法传递给 plot()。
柱状图:bar() 或 barh()
1
2
3
4
5
|
import pandas as pd
import numpy as np
df = pd.DataFrame(np.random.rand(10,4),columns=['a','b','c','d'])
#或使用df.plot(kind="bar")
df.plot.bar()
|

1
2
3
4
5
6
7
|
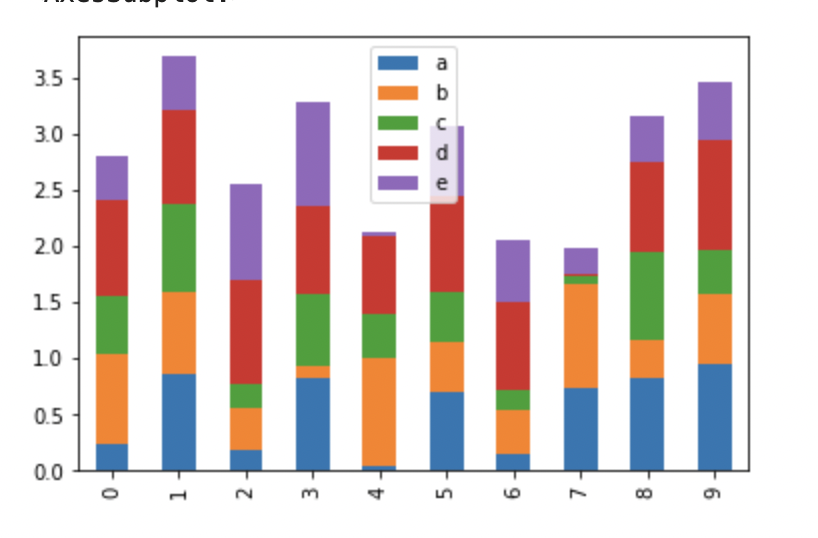
# 通过设置参数stacked=True可以生成柱状堆叠图,示例如下:

import pandas as pd
import numpy as np
df = pd.DataFrame(np.random.rand(10,5),columns=['a','b','c','d','e'])
df.plot(kind="bar",stacked=True)
#或者使用df.plot.bar(stacked="True")
|

1
2
3
4
5
6
7
|
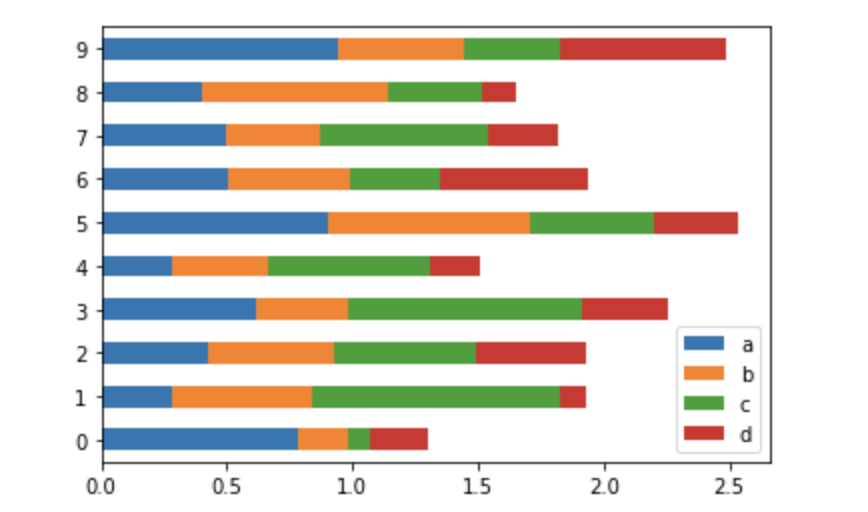
# 如果要绘制水平柱状图,您可以使用以下方法:

import pandas as pd
import numpy as np
df = pd.DataFrame(np.random.rand(10,4),columns=['a','b','c','d'])
print(df)
df.plot.barh(stacked=True)
|

直方图:hist()
1
2
3
4
5
6
7
8
|
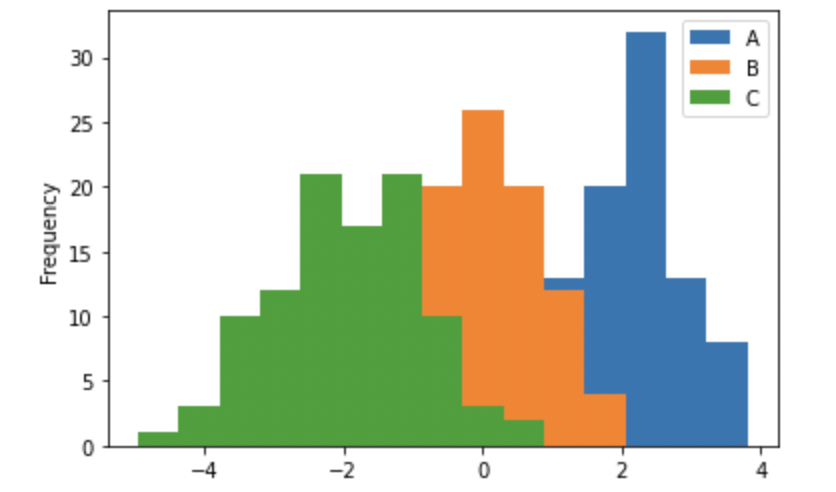
# 直方图 它还可以指定 bins(构成直方图的箱数)。
import pandas as pd
import numpy as np
df = pd.DataFrame({'A':np.random.randn(100)+2,'B':np.random.randn(100),'C':
np.random.randn(100)-2}, columns=['A', 'B', 'C'])
print(df)
#指定箱数为15
df.plot.hist(bins=15)
|

1
2
3
4
5
6
7
8
|
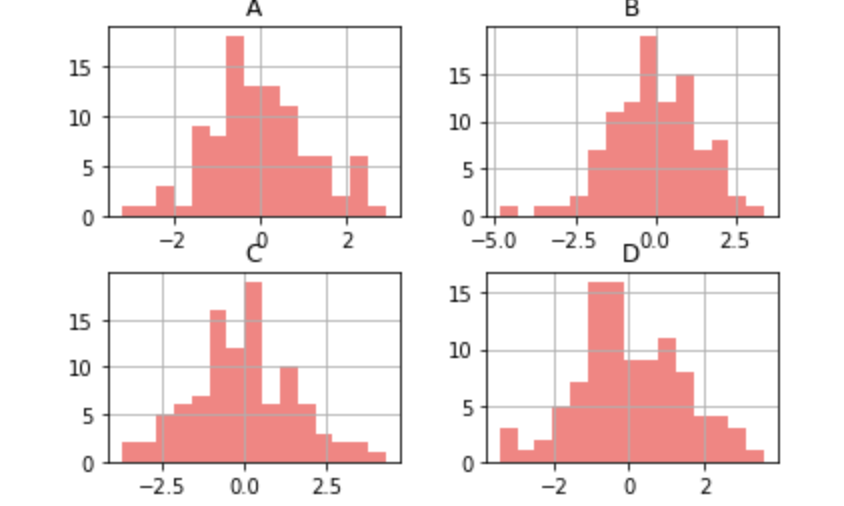
# 给每一列数据都绘制一个直方图,需要使以下方法:

import pandas as pd
import numpy as np
df = pd.DataFrame({'A':np.random.randn(100)+2,'B':np.random.randn(100),'C':
np.random.randn(100)-2,'D':np.random.randn(100)+3},columns=['A', 'B', 'C','D'])
#使用diff绘制
df.diff().hist(color="r",alpha=0.5,bins=15
|

箱状箱:box()
1
2
3
4
5
6
7
|
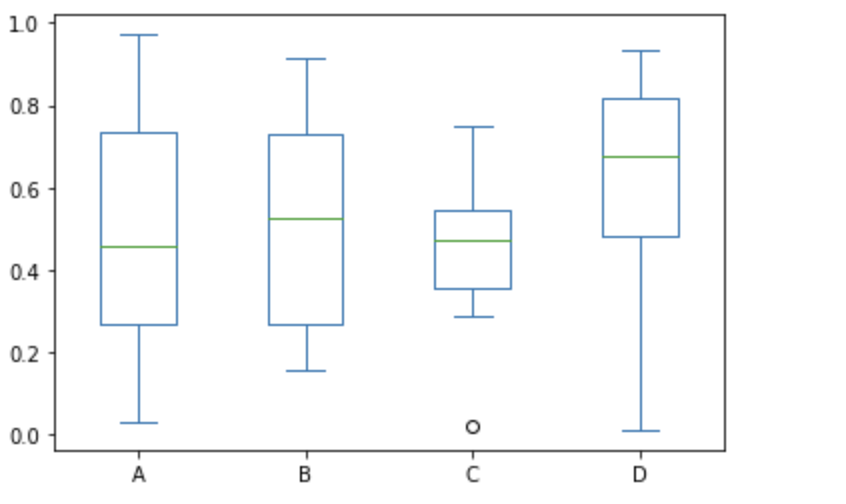
# 箱型图
# 通过调用 Series.box.plot() 、DataFrame.box.plot() 或者 DataFrame.boxplot() 方法来绘制箱型图,它将每一列数据的分布情况,以可视化的图像展现出来。

import pandas as pd
import numpy as np
df = pd.DataFrame(np.random.rand(10, 4), columns=['A', 'B', 'C', 'D'])
df.plot.box()
|

区域图:area()
1
2
3
4
5
6
7
8
|
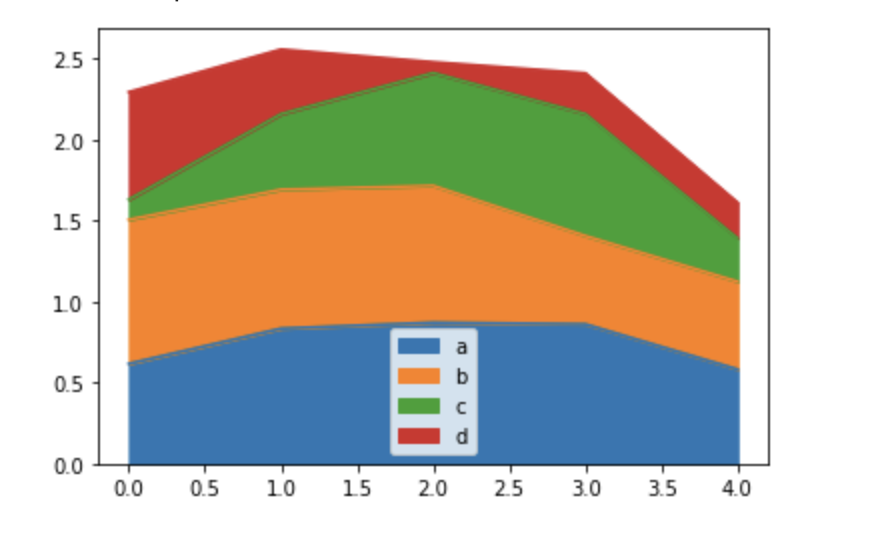
# 区域图
# 您可以使用 Series.plot.area() 或 DataFrame.plot.area() 方法来绘制区域图。


import pandas as pd
import numpy as np
df = pd.DataFrame(np.random.rand(5, 4), columns=['a', 'b', 'c', 'd'])
df.plot.area()
|

散点图:scatter()
1
2
3
4
5
6
7
8
|
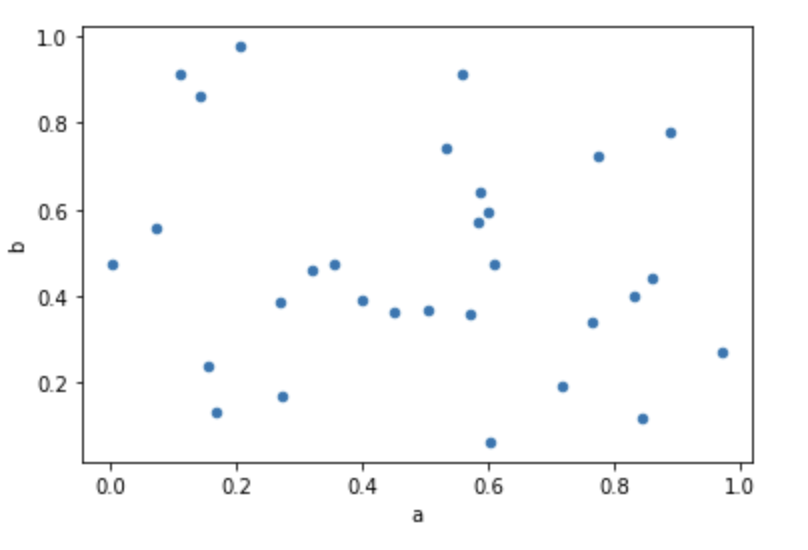
# 散点图
# 使用 DataFrame.plot.scatter() 方法来绘制散点图,如下所示:


import pandas as pd
import numpy as np
df = pd.DataFrame(np.random.rand(30, 4), columns=['a', 'b', 'c', 'd'])
df.plot.scatter(x='a',y='b')
|

饼图
1
2
3
4
5
6
|
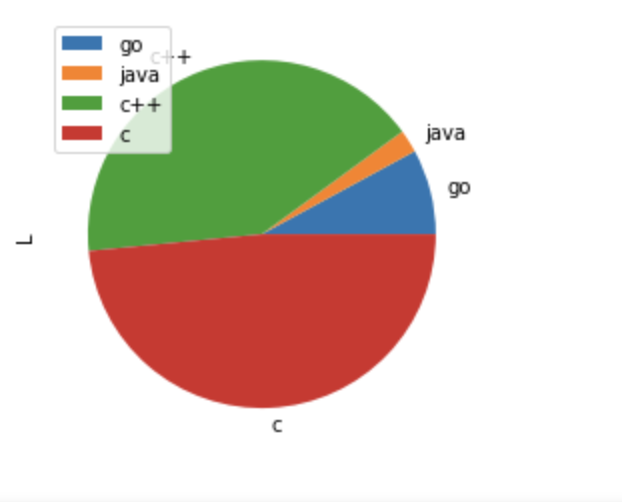
# 饼状图
# 饼状图可以通过 DataFrame.plot.pie() 方法来绘制。示例如下:
import pandas as pd
import numpy as np
df = pd.DataFrame(3 * np.random.rand(4), index=['go', 'java', 'c++', 'c'], columns=['L'])
df.plot.pie(subplots=True)
|

读取csv文件
CSV 又称逗号分隔值文件,是一种简单的文件格式,以特定的结构来排列表格数据。 CSV 文件能够以纯文本形式存储表格数据,比如电子表格、数据库文件,并具有数据交换的通用格式。CSV 文件会在 Excel 文件中被打开,其行和列都定义了标准的数据格式
在 Pandas 中用于读取文本的函数有两个,分别是: read_csv() 和 read_table() ,它们能够自动地将表格数据转换为 DataFrame 对象。
read_csv()格式如下:
1
|
pandas.read_csv(filepath_or_buffer, sep=',', delimiter=None, header='infer',names=None, index_col=None, usecols=None)
|
read_csv()
read_csv() 表示从 CSV 文件中读取数据,并创建 DataFrame 对象。
1
2
3
4
|
import pandas
#仅仅一行代码就完成了数据读取,但是注意文件路径不要写错
df = pandas.read_csv('C:/Users/Administrator/Desktop/hrd.csv')
print(df)
|
1) 自定义索引
在 CSV 文件中指定了一个列,然后使用index_col可以实现自定义索引。
1
2
3
|
import pandas as pd
df=pd.read_csv("C:/Users/Administrator/Desktop/person.csv",index_col=['ID'])
print(df)
|
2) 查看每一列的dtype
1
2
3
4
|
import pandas as pd
#转换salary为float类型
df=pd.read_csv("C:/Users/Administrator/Desktop/person.csv",dtype={'Salary':np.float64})
print(df.dtypes)
|
3) 更改文件标头名
使用 names 参数可以指定头文件的名称。
1
2
3
4
5
|
import pandas as pd
# 注意:文件标头名是附加的自定义名称,但是您会发现,原来的标头名(列标签名)并没有被删除,此时您可以使用header参数来删除它(假如原标头名并没有定义在第一行,您也可以传递相应的行号来删除它)。
df=pd.read_csv("C:/Users/Administrator/Desktop/person.csv",names=['a','b','c','d','e'],header=0)

print(df)
|
4) 跳过指定的行数
1
2
3
4
5
|
# skiprows参数表示跳过指定的行数。
import pandas as pd
df=pd.read_csv("C:/Users/Administrator/Desktop/person.csv",skiprows=2)
print(df)
# 注意:包含标头所在行。
|
to_csv()
用于将 DataFrame 转换为 CSV 数据。如果想要把 CSV 数据写入文件,只需向函数传递一个文件对象即可。否则,CSV 数据将以字符串格式返回。
1
2
3
4
5
|
import pandas as pd
#注意:pd.NaT表示null缺失数据
data = {'Name': ['Smith', 'Parker'], 'ID': [101, pd.NaT], 'Language': ['Python', 'JavaScript']}
info = pd.DataFrame(data)
csv_data = info.to_csv("C:/Users/Administrator/Desktop/pandas.csv",sep='|') # 指定 CSV 文件输出时的分隔符,并将其保存在 pandas.csv 文件中
|
读写Excel
to_excel()
通过 to_excel() 函数可以将 Dataframe 中的数据写入到 Excel 文件。
如果想要把单个对象写入 Excel 文件,那么必须指定目标文件名;如果想要写入到多张工作表中,则需要创建一个带有目标文件名的ExcelWriter对象,并通过sheet_name参数依次指定工作表的名称。
to_excel()语法格式如下:
 1
 2
 3
 4
 5
 6
 7
 8
 9
10
11
12
13
14
15
16
17
18
19
|
DataFrame.to_excel(excel_writer, sheet_name='Sheet1', na_rep='', float_format=None, columns=None, header=True, index=True, index_label=None, startrow=0, startcol=0, engine=None, merge_cells=True, encoding=None, inf_rep='inf', verbose=True, freeze_panes=None)


"""
参数项
参数名称	描述说明
excel_wirter	文件路径或者 ExcelWrite 对象。
sheet_name	指定要写入数据的工作表名称。
na_rep	缺失值的表示形式。
float_format	它是一个可选参数,用于格式化浮点数字符串。
columns	指要写入的列。
header	写出每一列的名称,如果给出的是字符串列表,则表示列的别名。
index	表示要写入的索引。
index_label	引用索引列的列标签。如果未指定,并且 hearder 和 index 均为为 True,则使用索引名称。如果 DataFrame 使用 MultiIndex,则需要给出一个序列。
startrow	初始写入的行位置,默认值0。表示引用左上角的行单元格来储存 DataFrame。
startcol	初始写入的列位置,默认值0。表示引用左上角的列单元格来储存 DataFrame。
engine	它是一个可选参数,用于指定要使用的引擎,可以是 openpyxl 或 xlsxwriter。

"""
|
 1
 2
 3
 4
 5
 6
 7
 8
 9
10
11
|
import pandas as pd
#创建DataFrame数据
info_website = pd.DataFrame({'name': ['编程帮', 'c语言中文网', '微学苑', '92python'],
     'rank': [1, 2, 3, 4],
     'language': ['PHP', 'C', 'PHP','Python' ],
     'url': ['www.bianchneg.com', 'c.bianchneg.net', 'www.weixueyuan.com','www.92python.com' ]})
#创建ExcelWrite对象
writer = pd.ExcelWriter('website.xlsx')
info_website.to_excel(writer)
writer.save()
print('输出成功')
|
read_excel()
语法格式:
 1
 2
 3
 4
 5
 6
 7
 8
 9
10
11
12
13
14
15
16
17
18
19
20
21
22
23
24
|
pd.read_excel(io, sheet_name=0, header=0, names=None, index_col=None,
              usecols=None, squeeze=False,dtype=None, engine=None,
              converters=None, true_values=None, false_values=None,
              skiprows=None, nrows=None, na_values=None, parse_dates=False,
              date_parser=None, thousands=None, comment=None, skipfooter=0,
              convert_float=True, **kwds)


"""
参数
参数名称	说明
io	表示 Excel 文件的存储路径。
sheet_name	要读取的工作表名称。
header	指定作为列名的行,默认0,即取第一行的值为列名;若数据不包含列名,则设定 header = None。若将其设置 为 header=2,则表示将前两行作为多重索引。
names	一般适用于Excel缺少列名,或者需要重新定义列名的情况;names的长度必须等于Excel表格列的长度,否则会报错。
index_col	用做行索引的列,可以是工作表的列名称,如 index_col = ‘列名’,也可以是整数或者列表。
usecols	int或list类型,默认为None,表示需要读取所有列。
squeeze	boolean,默认为False,如果解析的数据只包含一列,则返回一个Series。
converters	规定每一列的数据类型。
skiprows	接受一个列表,表示跳过指定行数的数据,从头部第一行开始。
nrows	需要读取的行数。
skipfooter	接受一个列表,省略指定行数的数据,从尾部最后一行开始。
"""
|
1
2
3
4
5
6
|
import pandas as pd
#读取excel数据
df = pd.read_excel('website.xlsx',index_col='name',skiprows=[2])
#处理未命名列
df.columns = df.columns.str.replace('Unnamed.*', 'col_label')
print(df)
|
1
2
3
4
5
6
7
8
|
import pandas as pd
#读取excel数据
#index_col选择前两列作为索引列
#选择前三列数据,name列作为行索引
df = pd.read_excel('website.xlsx',index_col='name',index_col=[0,1],usecols=[1,2,3])
#处理未命名列,固定用法
df.columns = df.columns.str.replace('Unnamed.*', 'col_label')
print(df)
|
与Numpy
布尔索引
布尔索引是 NumPy 的重要特性之一,通常与 Pandas 一起使用。它的主要作用是过滤 DataFrame 中的数据,比如布尔值的掩码操作。
下面示例展示了如何使用布尔索引访问 DataFrame 中的数据。
首先创建一组包含布尔索引的数据,如下所示:
1
2
3
4
5
|
import pandas as pd
dict = {'name':["Smith", "William", "Phill", "Parker"],
        'age': ["28", "39", "34", "36"]}
info = pd.DataFrame(dict, index = [True, True, False, True])
print(info)
|
然后使用.loc访问索引为 True 的数据。示例如下:
1
2
3
4
5
6
|
import pandas as pd
dict = {'name':["Smith", "William", "Phill", "Parker"],
        'age': ["28", "39", "34", "36"]}
info = pd.DataFrame(dict, index = [True, True, False, True])
#返回所有为 True的数据
print(info.loc[True])
|
转换ndarray数组
在某些情况下,需要执行一些 NumPy 数值计算的高级函数,这个时候您可以使用 to_numpy() 函数,将 DataFrame 对象转换为 NumPy ndarray 数组,并将其返回。函数的语法格式如下:
1
2
3
4
5
6
7
8
|
info = pd.DataFrame({"P": [2, 3], "Q": [4.0, 5.8]})
#给info添加R列
info['R'] = pd.date_range('2020-12-23', periods=2)
print(info)
#将其转化为numpy数组
n=info.to_numpy()
print(n)
print(type(n))
|
1
2
3
4
5
6
7
8
|
import pandas as pd
#创建DataFrame对象
info = pd.DataFrame([[17, 62, 35],[25, 36, 54],[42, 20, 15],[48, 62, 76]],
columns=['x', 'y', 'z'])
print('DataFrame\n----------\n', info)
#转换DataFrame为数组array
arr = info.to_numpy()
print('\nNumpy Array\n----------\n', arr)
|
读取json文件
1
2
3
|
import pandas as pd
data = pd.read_json('C:/Users/Administrator/Desktop/hrd.json')
print(data)
|
区别

